IBM 2007 Annual Report Download - page 33
Download and view the complete annual report
Please find page 33 of the 2007 IBM annual report below. You can navigate through the pages in the report by either clicking on the pages listed below, or by using the keyword search tool below to find specific information within the annual report.-
 1
1 -
2
-
3
-
4
-
5
-
6
-
7
-
8
-
9
-
10
-
11
-
12
-
13
-
14
-
15
-
16
-
17
-
18
-
19
-
20
-
21
-
22
-
 23
23 -
 24
24 -
 25
25 -
 26
26 -
 27
27 -
 28
28 -
 29
29 -
 30
30 -
 31
31 -
 32
32 -
 33
33 -
 34
34 -
 35
35 -
 36
36 -
 37
37 -
 38
38 -
 39
39 -
 40
40 -
 41
41 -
 42
42 -
 43
43 -
44
-
45
-
46
-
47
-
48
-
49
-
50
-
51
-
52
-
53
-
54
-
55
-
56
-
57
-
58
-
59
-
60
-
61
-
62
-
63
-
64
-
65
-
66
-
67
-
68
-
69
-
70
-
71
-
72
-
73
-
74
-
75
-
76
-
77
-
78
-
79
-
80
-
81
-
82
-
83
-
84
-
85
-
86
-
87
-
88
-
89
-
90
-
91
-
92
-
93
-
94
-
95
-
96
-
97
-
98
-
99
-
100
-
101
-
102
-
103
-
104
-
105
-
106
-
107
-
108
-
109
-
110
-
111
-
112
-
113
-
114
-
115
-
116
-
117
-
118
-
119
-
120
-
121
-
122
-
123
-
124
-
125
-
126
-
127
-
128
 |
 |

Management Discussion
International Business Machines Corporation and Subsidiary Companies
31
Acquired Intangible Asset Amortization
The company has been investing in targeted acquisitions primarily in
its Software and Global Services segments to increase its capabilities
in higher value market segments. The following table presents the
total acquired intangible asset amortization included in the Consol-
idated Statement of Earnings. See note I, “Intangible Assets Including
Goodwill,” on pages 84 and 85 for additional information.
($ in millions)
YR.-TO-YR.
FOR THE YEAR ENDED DECEMBER 31: 2007 2006* CHANGE
Cost:
Software $ 91 $ 81 12.6%
Services 42 12 252.7
Hardware — 3 NM
Selling, general and
administrative expense 234 220 6.7
Total $367 $316 16.3%
* Reclassified to conform with 2007 presentation of Services and Selling, general and
administrative expense categories.
NM — Not meaningful
Income Taxes
The effective tax rate for 2007 was 28.1 percent, compared with 29.3
percent in 2006. The 1.2 point decrease was primarily driven by the
absence of the one-time tax cost associated with the intercompany
transfer of certain intellectual property in the fourth quarter of 2006
(4.3 points) and the absence of the benefit from the settlement of the
U.S. federal income tax audit for the years 2001 through 2003, also in
the fourth quarter of 2006 (3.0 points). The company also benefited
in 2007 from a more favorable mix of income in lower tax rate juris-
dictions and increased capital loss and state credit benefits, offset by a
reduction in certain tax incentives.
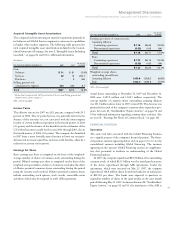
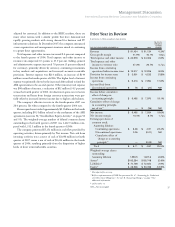
Earnings Per Share
Basic earnings per share is computed on the basis of the weighted-
average number of shares of common stock outstanding during the
period. Diluted earnings per share is computed on the basis of the
weighted-average number of shares of common stock plus the effect
of dilutive potential common shares outstanding during the period
using the treasury stock method. Dilutive potential common shares
include outstanding stock options, stock awards, convertible notes
and shares which may be required to settle ASR agreements.
YR.-TO-YR.
FOR THE YEAR ENDED DECEMBER 31: 2007 2006 CHANGE
Earnings per share of common stock:
Assuming dilution:
Continuing operations $ 7.18 $6.06 18.5%
Discontinued operations (0.00) 0.05 NM
Total $ 7.18 $6.11 17.5%
Basic:
Continuing operations $ 7.32 $6.15 19.0%
Discontinued operations (0.00) 0.05 NM
Total $ 7.32 $6.20 18.1%
Weighted-average shares
outstanding (in millions):
Assuming dilution 1,450.6 1,553.5 (6.6)%
Basic 1,423.0 1,530.8 (7.0)%
NM — Not meaningful
Actual shares outstanding at December 31, 2007 and December 31,
2006 were 1,385.2 million and 1,506.5 million, respectively. The
average number of common shares outstanding assuming dilution
was 103.0 million shares lower in 2007 versus 2006. The decrease was
primarily the result of the company’s common share repurchase pro-
gram. See note M, “Stockholders’ Equity Activity,” on pages 92 and
93 for additional information regarding common share activities. Also
see note R, “Earnings Per Share of Common Stock,” on page 101.
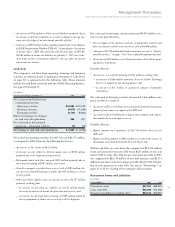
FINANCIAL POSITION
Dynamics
The assets and debt associated with the Global Financing business
are a significant part of the company’s financial position. The finan-
cial position amounts appearing below and on pages 32 to 35 are the
consolidated amounts including Global Financing. The amounts
appearing in the separate Global Financing section are supplemen-
tary data presented to facilitate an understanding of the Global
Financing business.
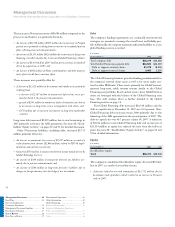
In 2007, the company repurchased $18.8 billion of its outstanding
common stock, of which $12.5 billion was the initial purchase price
of the shares repurchased through ASR agreements. Under the
agreements, which were executed on May 25, 2007, the company
repurchased 118.8 million shares from three banks for an initial price
of $105.18 per share. The banks were expected to purchase an
equivalent number of shares in the open market in the nine month
period following May 25, 2007. As discussed in note M, “Stockholders’
Equity Activity,” on pages 92 and 93, the initial price of the ASR is