IBM 2007 Annual Report Download - page 37
Download and view the complete annual report
Please find page 37 of the 2007 IBM annual report below. You can navigate through the pages in the report by either clicking on the pages listed below, or by using the keyword search tool below to find specific information within the annual report.-
 1
1 -
2
-
3
-
4
-
5
-
6
-
7
-
8
-
9
-
10
-
11
-
12
-
13
-
14
-
15
-
16
-
17
-
18
-
19
-
20
-
21
-
22
-
23
-
24
-
25
-
26
-
 27
27 -
 28
28 -
 29
29 -
 30
30 -
 31
31 -
 32
32 -
 33
33 -
 34
34 -
 35
35 -
 36
36 -
 37
37 -
 38
38 -
 39
39 -
 40
40 -
 41
41 -
 42
42 -
 43
43 -
 44
44 -
 45
45 -
 46
46 -
 47
47 -
48
-
49
-
50
-
51
-
52
-
53
-
54
-
55
-
56
-
57
-
58
-
59
-
60
-
61
-
62
-
63
-
64
-
65
-
66
-
67
-
68
-
69
-
70
-
71
-
72
-
73
-
74
-
75
-
76
-
77
-
78
-
79
-
80
-
81
-
82
-
83
-
84
-
85
-
86
-
87
-
88
-
89
-
90
-
91
-
92
-
93
-
94
-
95
-
96
-
97
-
98
-
99
-
100
-
101
-
102
-
103
-
104
-
105
-
106
-
107
-
108
-
109
-
110
-
111
-
112
-
113
-
114
-
115
-
116
-
117
-
118
-
119
-
120
-
121
-
122
-
123
-
124
-
125
-
126
-
127
-
128
 |
 |

Management Discussion
International Business Machines Corporation and Subsidiary Companies
35
This reduction was offset by:
U An increase of $8,208 million in Retained earnings primarily driven by
Net income of $10,418 million, partially offset by dividends ($2,147 mil-
lion); and
U An increase of $5,487 million in Accumulated gains and (losses) not
affecting retained earnings primarily resulting from the non-cash equity
impacts related to an increase in overfunded pension plans reflecting year-
end remeasurements.
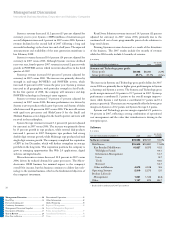
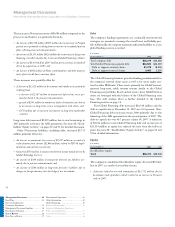
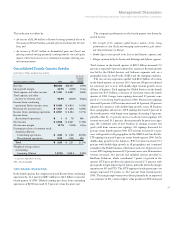
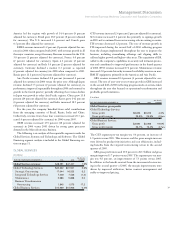
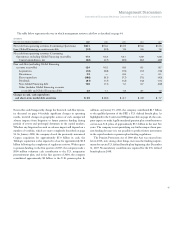
Consolidated Fourth-Quarter Results
($ and shares in millions except per share amounts)
YR.-TO-YR.
PERCENT/
MARGIN
FOR THE FOURTH QUARTER: 2007 2006 CHANGE
Revenue $28,866 $26,257 9.9%*
Gross profit margin 44.9% 44.6% 0.4 pts.
Total expense and other income $ 7,481 $ 6,887 8.6%
Total expense and other
income-to-revenue ratio 25.9% 26.2% (0.3)pts.
Income from continuing
operations before income taxes $ 5,489 $ 4,814 14.0%
Provision for income taxes $ 1,537 $ 1,350 13.9%
Income from continuing operations $ 3,951 $ 3,464 14.1%
Income from
discontinued operations $ 1 $ 76 NM
Net income $ 3,952 $ 3,541 11.6%
Net income margin 13.7% 13.5% 0.2 pts.
Earnings per share of common stock:
Assuming dilution:
Continuing operations $ 2.80 $ 2.26 23.9%
Discontinued operations 0.00 0.05 NM
Total $ 2.80 $ 2.31 21.2%
Weighted-average shares
outstanding:
Assuming dilution 1,412.9 1,532.5 (7.8)%
* 4.2 percent adjusted for currency.
NM — Not meaningful
CONTINUING OPERATIONS
In the fourth quarter, the company increased Income from continuing
operations by 14.1 percent ($487 million) to $4.0 billion versus the
fourth quarter of 2006. Diluted earnings per share from continuing
operations of $2.80 increased 23.9 percent versus the prior year.
The company’s performance in the fourth quarter was driven by
several factors:
U The strength of the company’s global business model — led by strong
performance in Asia Pacific and emerging country markets, plus contin-
ued solid performance in Europe;
U Double-digit revenue growth in the Services and Software segments; and
U Margin expansion led by the Systems and Technology and Software segments.
Total revenue in the fourth quarter of $28.9 billion increased 9.9
percent as reported (4 percent adjusted for currency). Revenue growth
was led by the Global Services and Software segments and, on a
geographic basis, by Asia Pacific, EMEA and the emerging countries.
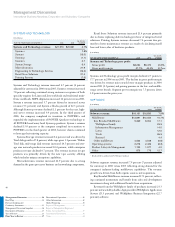
The two services segments together had $14.9 billion of revenue
in the fourth quarter, an increase of 16.5 percent (10 percent adjusted
for currency) year to year, with double-digit revenue growth across
all lines of business. Total signings for Global Services in the fourth
quarter were $15.4 billion, a decrease of 13 percent versus the fourth
quarter of 2006. Longer term signings decreased 25 percent com-
pared to a very strong fourth quarter in 2006. Shorter term signings
increased 8 percent. GTS revenue increased 16.4 percent (10 percent
adjusted for currency), with double-digit growth across all business
lines, geographies and sectors. GTS signings decreased 9 percent in
the fourth quarter, with longer term signings decreasing 14 percent,
partially offset by a 6 percent increase in shorter term signings. SO
revenue increased 14.5 percent, driven primarily by prior-year sign-
ings, the continued sales of new business in existing accounts and
good yield from current-year signings. SO signings decreased 26
percent versus fourth-quarter 2006. ITS revenue increased 11.4 per-
cent, with growth in all geographies, led by EMEA and Asia Pacific.
ITS signings increased 6 percent versus fourth-quarter 2006, led by
double-digit growth in the Americas. BTO revenue increased 56.5
percent with double-digit growth in all geographies and continued
strength in the Daksh business, which increased over 40 percent year
to year. BTO signings increased 147 percent year to year. Maintenance
revenue increased 16.2 percent and included services provided to
InfoPrint Solutions, which contributed 7 points of growth in the
quarter. GTS gross profit in the quarter increased 17.2 percent, with
gross profit margin improving 0.2 points, primarily driven by margin
expansion in SO and ITS. The GTS segment fourth-quarter pre-tax
margin improved 0.9 points to 10.2 percent from fourth-quarter
2006. The margin improvement was driven primarily by an improved
cost structure in SO, a mix to higher value products in ITS and good