IBM 2007 Annual Report Download - page 35
Download and view the complete annual report
Please find page 35 of the 2007 IBM annual report below. You can navigate through the pages in the report by either clicking on the pages listed below, or by using the keyword search tool below to find specific information within the annual report.
Management Discussion
International Business Machines Corporation and Subsidiary Companies
33
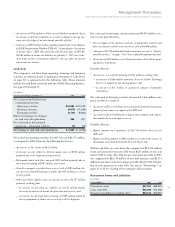
U An increase of $528 million in Other accrued liabilities primarily due to
an increase in derivative liabilities as a result of changes in foreign cur-
rency rates for hedges of net investment; partially offset by
U A decrease of $997 million in Taxes payable primarily due to the adoption
of FASB Interpretation Number (FIN) 48, “Accounting for Uncertainty
in Income Taxes” (FIN 48); consistent with the provisions of FIN 48,
$2,066 million of income tax liabilities on January 1, 2007 was reclas-
sified from current to noncurrent liabilities; this was offset by current
year income tax activity.
Cash Flow
The company’s cash flow from operating, investing and financing
activities, as reflected in the Consolidated Statement of Cash Flows
on page 60, is summarized in the following table. These amounts
include the cash flows associated with the Global Financing business.
See pages 52 through 55.
($ in millions)
FOR THE YEAR ENDED DECEMBER 31: 2007 2006
Net cash provided by/(used in)
continuing operations:
Operating activities $16,094 $ 15,019
Investing activities (4,675) (11,549)
Financing activities (4,740) (8,204)
Effect of exchange rate changes
on cash and cash equivalents 294 201
Net cash used in discontinued
operations — Operating activities (5) (12)
Net change in cash and cash equivalents $ 6,969 $ (4,546)
Net cash from operating activities for 2007 increased $1,075 million
as compared to 2006 driven by the following key factors:
U An increase in Net income of $925 million;
U A decrease in cash related to deferred income taxes of $984 million
primarily due to the impact of pension activity;
U Retirement-related cash flows increased $622 million primarily due to
lower pension funding of $795 million year to year;
U Growth in accounts receivable drove a use of cash of $896 million; this
was driven by Global Financing receivables ($1,045 million) as a result
of asset growth;
U Other assets/other liabilities drove an increase in cash of $1,587 million
primarily resulting from:
— an increase in cash from tax liabilities of $1,185 million mainly
driven by an increase in income tax provisions and reserves; and
— an increase in cash from deferred income of $398 million primarily
due to prepayment of future services to be provided to Infoprint.
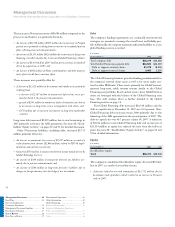
Net cash used in investing activities decreased $6,874 million on a
year-to-year basis driven by:
U The net impact of the purchases and sales of marketable securities and
other investments resulted in an increase in cash of $4,006 million;
U A decrease of $2,790 million utilized for acquisitions (see note C, “Acquisi-
tions/Divestitures,” on pages 76 to 78 for additional information); and
U An increase of $310 million received from divestitures driven by the print-
ing business transaction;
Partially offset by:
U An increase in net capital spending of $231 million resulting from:
— an increase of $160 million primarily driven by Global Technology
Services to support the outsourcing business; and
— an increase of $71 million in capitalized software development
expenditures.
Net cash used in financing activities decreased $3,464 million com-
pared to 2006 as a result of:
U An increase of $12,233 million in net cash proceeds from debt transactions
primarily from issuances in support of the ASR; and
U An increase of $2,438 million due to higher other common stock transac-
tions mainly due to stock option exercises;
Partially offset by:
U Higher common stock repurchases of $10,744 million driven by the
ASR; and
U Higher dividend payments of $464 million as a result of the increase in
the common stock dividend from $1.10 to $1.50 per share.
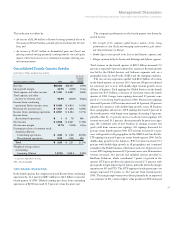
Within total debt, on a net basis, the company had $12,112 million
in net cash proceeds from new debt versus $121 million in net cash
used in 2006 to retire debt. The net proceeds from new debt in 2007
was comprised of: $21,744 million of new debt issuances and $1,674
million in net short-term borrowings, partially offset by $11,306 mil-
lion in cash payments to settle debt. See note J, “Borrowings,” on
pages 85 to 88 for a listing of the company’s debt securities.
Noncurrent Assets and Liabilities
($ in millions)
AT DECEMBER 31: 2007 2006
Noncurrent assets $67,254 $58,574
Long-term debt $23,039 $13,780
Noncurrent liabilities (excluding debt) $24,612 $20,857


