IBM 2007 Annual Report Download - page 103
Download and view the complete annual report
Please find page 103 of the 2007 IBM annual report below. You can navigate through the pages in the report by either clicking on the pages listed below, or by using the keyword search tool below to find specific information within the annual report.-
 1
1 -
2
-
3
-
4
-
5
-
6
-
7
-
8
-
9
-
10
-
11
-
12
-
13
-
14
-
15
-
16
-
17
-
18
-
19
-
20
-
21
-
22
-
23
-
24
-
25
-
26
-
27
-
28
-
29
-
30
-
31
-
32
-
33
-
34
-
35
-
36
-
37
-
38
-
39
-
40
-
41
-
42
-
43
-
44
-
45
-
46
-
47
-
48
-
49
-
50
-
51
-
52
-
53
-
54
-
55
-
56
-
57
-
58
-
59
-
60
-
61
-
62
-
63
-
64
-
65
-
66
-
67
-
68
-
69
-
70
-
71
-
72
-
73
-
74
-
75
-
76
-
77
-
78
-
79
-
80
-
81
-
82
-
83
-
84
-
85
-
86
-
87
-
88
-
89
-
90
-
91
-
92
-
 93
93 -
 94
94 -
 95
95 -
 96
96 -
 97
97 -
 98
98 -
 99
99 -
 100
100 -
 101
101 -
 102
102 -
 103
103 -
 104
104 -
 105
105 -
 106
106 -
 107
107 -
 108
108 -
 109
109 -
 110
110 -
 111
111 -
 112
112 -
 113
113 -
114
-
115
-
116
-
117
-
118
-
119
-
120
-
121
-
122
-
123
-
124
-
125
-
126
-
127
-
128
 |
 |

101
Notes to Consolidated Financial Statements
International Business Machines Corporation and Subsidiary Companies
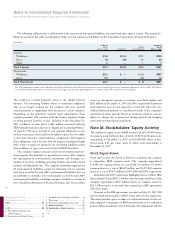
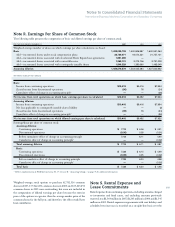
Note R. Earnings Per Share of Common Stock
The following table presents the computation of basic and diluted earnings per share of common stock:
FOR THE YEAR ENDED DECEMBER 31: 2007 2006 2005
Weighted-average number of shares on which earnings per share calculations are based:
Basic 1,423,039,793 1,530,806,987 1,600,591,264
Add — incremental shares under stock compensation plans 22,730,971 18,074,331 21,757,121
Add — incremental shares associated with Accelerated Share Repurchase agreements 1,891,095 — —
Add — incremental shares associated with convertible notes 1,362,191 3,273,706 3,791,228
Add — incremental shares associated with contingently issuable shares 1,546,529 1,380,360 1,493,049
Assuming dilution 1,450,570,579 1,553,535,384 1,627,632,662
($ in millions except per share amounts)
Basic:
Income from continuing operations $10,418 $9,416 $7,994
(Loss)/income from discontinued operations (00) 76 (24)
Cumulative effect of change in accounting principle* — — (36)
Net income from total operations on which basic earnings per share is calculated $10,418 $9,492 $7,934
Assuming dilution:
Income from continuing operations $10,418 $9,416 $7,994
Net loss applicable to contingently issuable shares liability — — (2)
(Loss)/income from discontinued operations (00) 76 (24)
Cumulative effect of change in accounting principle* — — (36)
Net income from total operations on which diluted earnings per share is calculated $10,418 $9,492 $7,932
Earnings/(loss) per share of common stock:
Assuming dilution:
Continuing operations $ 7.18 $ 6.06 $ 4.91
Discontinued operations (0.00) 0.05 (0.01)
Before cumulative effect of change in accounting principle 7.18 6.11 4.90
Cumulative effect of change in accounting principle* — — (0.02)
Total assuming dilution $ 7.18 $ 6.11 $ 4.87
Basic:
Continuing operations $ 7.32 $ 6.15 $ 4.99
Discontinued operations (0.00) 0.05 (0.02)
Before cumulative effect of change in accounting principle 7.32 6.20 4.98
Cumulative effect of change in accounting principle* — — (0.02)
Total basic $ 7.32 $ 6.20 $ 4.96
* Reflects implementation of FASB Interpretation No. 47. See note B, “Accounting Changes,” on page 75 for additional information.
Weighted-average stock options to purchase 62,782,516 common
shares in 2007, 157,942,283 common shares in 2006 and 165,615,293
common shares in 2005 were outstanding, but were not included in
the computation of diluted earnings per share because the exercise
price of the options was greater than the average market price of the
common shares for the full year, and therefore, the effect would have
been antidilutive.
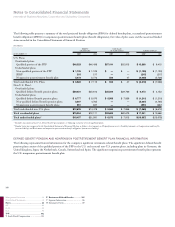
Note S. Rental Expense and
Lease Commitments
Rental expense from continuing operations, including amounts charged
to inventories and fixed assets, and excluding amounts previously
reserved, was $1,364 million in 2007, $1,263 million in 2006 and $1,345
million in 2005. Rental expense in agreements with rent holidays and
scheduled rent increases is recorded on a straight-line basis over the