IBM 2007 Annual Report Download - page 43
Download and view the complete annual report
Please find page 43 of the 2007 IBM annual report below. You can navigate through the pages in the report by either clicking on the pages listed below, or by using the keyword search tool below to find specific information within the annual report.-
 1
1 -
2
-
3
-
4
-
5
-
6
-
7
-
8
-
9
-
10
-
11
-
12
-
13
-
14
-
15
-
16
-
17
-
18
-
19
-
20
-
21
-
22
-
23
-
24
-
25
-
26
-
27
-
28
-
29
-
30
-
31
-
32
-
 33
33 -
 34
34 -
 35
35 -
 36
36 -
 37
37 -
 38
38 -
 39
39 -
 40
40 -
 41
41 -
 42
42 -
 43
43 -
 44
44 -
 45
45 -
 46
46 -
 47
47 -
 48
48 -
 49
49 -
 50
50 -
 51
51 -
 52
52 -
 53
53 -
54
-
55
-
56
-
57
-
58
-
59
-
60
-
61
-
62
-
63
-
64
-
65
-
66
-
67
-
68
-
69
-
70
-
71
-
72
-
73
-
74
-
75
-
76
-
77
-
78
-
79
-
80
-
81
-
82
-
83
-
84
-
85
-
86
-
87
-
88
-
89
-
90
-
91
-
92
-
93
-
94
-
95
-
96
-
97
-
98
-
99
-
100
-
101
-
102
-
103
-
104
-
105
-
106
-
107
-
108
-
109
-
110
-
111
-
112
-
113
-
114
-
115
-
116
-
117
-
118
-
119
-
120
-
121
-
122
-
123
-
124
-
125
-
126
-
127
-
128
 |
 |

Management Discussion
International Business Machines Corporation and Subsidiary Companies
41
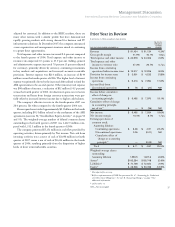
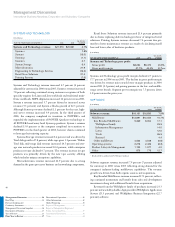
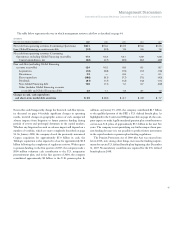
Total SG&A expense of $20,259 million decreased 4.9 percent
versus 2005. The decrease was primarily driven by the restructuring
charges recorded in the second quarter of 2005. In addition, retire-
ment-related expense and stock-based compensation decreased versus
2005. Those decreases were partially offset by increased operational
expenses as a result of strategic acquisitions and investments in the
software and services businesses as well as emerging countries.
Other (income) and expense was income of $766 million and
$2,122 million in 2006 and 2005, respectively. The decrease in income
was primarily driven by the $1,108 million pre-tax gain on the sale of
the Personal Computing business in 2005. In addition, the company
settled certain antitrust issues with the Microsoft Corporation in
2005 and the gain from this settlement was $775 million. Income
from certain real estate activities decreased year to year, as 2005 had
unusually large gains from a few transactions. Partially offsetting
those decreases were additional Interest income; foreign currency
transaction gains in 2006 versus losses in 2005 and real estate related
restructuring charges recorded in the second quarter of 2005.
RD&E expense of $6,107 million increased 4.5 percent primarily
driven by acquisitions and investments to maintain technology lead-
ership across the product offerings. Software spending increased
$210 million and Systems and Technology spending increased $92
million in 2006 versus 2005. These increases were partially offset by
the year-to-year reduction in Personal Computing of $52 million due
to the divestiture of that business in 2005.
Intellectual property and custom development income of $900
million decreased $48 million or 5.0 percent versus 2005. There were
no significant IP transactions in 2006 and 2005.
Interest expense of $278 million increased $58 million, or 26.6
percent in 2006, primarily driven by higher effective interest rates
year to year.
INCOME TAXES
The provision for income taxes resulted in an effective tax rate of
29.3 percent for 2006, compared with the 2005 effective tax rate of
34.6 percent. The 5.3 point improvement in the tax rate was driven
by the absence of the foreign earnings repatriation-related tax charge
recorded in the third quarter of 2005 (4.3 points) as well as a benefit
from the fourth-quarter 2006 settlement of the U.S. federal income
tax audit for the years 2001 through 2003 (3.0 points). Those benefits
were partially offset by a one-time tax cost associated with the 2006
intercompany transfer of certain intellectual property (4.3 points).
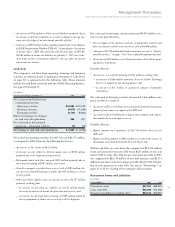
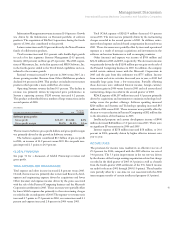
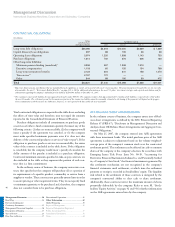
Information Management revenue increased 14.0 percent. Growth
was driven by the Information on Demand portfolio of software
products. The acquisition of FileNet Corporation, during the fourth
quarter of 2006, also contributed to the growth.
Lotus revenue increased 12.0 percent driven by the Notes/Domino
family of collaboration products.
Tivoli revenue increased 26.3 percent with double-digit growth
in each of its key segments: Systems Management (24.5 percent),
Security (40.8 percent) and Storage (27.4 percent). The 2006 acquisi-
tions of Micromuse, Inc. in the first quarter and MRO Software, Inc.
in the fourth quarter added to the Tivoli brand capabilities and con-
tributed to the revenue growth.
Rational revenue increased 4.4 percent in 2006 versus 2005, in a
slower growing market. Revenue from Other Middleware products
declined 0.6 percent in 2006. This product set includes more mature
products which provide a more stable flow of revenue.
Operating Systems revenue declined 6.3 percent. The decline in
revenue was primarily driven by improved price performance in
System z operating systems. PLM revenue increased 4.2 percent.
This product set benefited from a number of large transactions in the
second quarter of 2006.
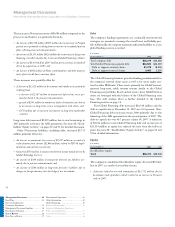
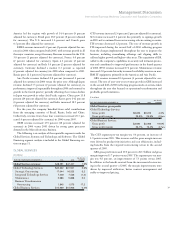
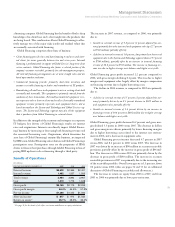
($ in millions)
YR.-TO-YR.
FOR THE YEAR ENDED DECEMBER 31: 2006 2005 CHANGE
Software gross profit:
Gross profit $15,471 $14,296 8.2%
Gross profit margin 85.2% 84.9% 0.2 pts.
The increase in Software gross profit dollars and gross profit margin
was primarily driven by the growth in Software revenue.
The Software segment contributed $5.5 billion of pre-tax profit
in 2006, an increase of 14.9 percent versus 2005. Pre-tax profit mar-
gins improved 1.5 points to 26.9 percent.
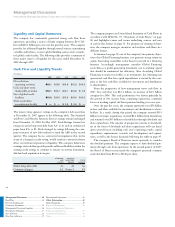
GLOBAL FINANCING
See page 51 for a discussion of Global Financing’s revenue and
gross profit.
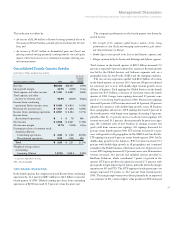
TOTAL EXPENSE AND OTHER INCOME
Total expense and other income increased 2.8 percent versus 2005.
Overall, the increase was primarily due to increased Research, devel-
opment and engineering expense driven by acquisitions and lower
Other (income) and expense income driven by the gains associated
with the sale of the Personal Computing business and the Microsoft
Corporation settlement in 2005. Those increases were partially offset
by lower SG&A expense due primarily to the restructuring charges
recorded in the second quarter of 2005.The expense-to-revenue ratio
increased 0.7 points to 27.3 percent in 2006, as revenue increased 0.3
percent and expense increased 2.8 percent in 2006 versus 2005.