IBM 2007 Annual Report Download - page 119
Download and view the complete annual report
Please find page 119 of the 2007 IBM annual report below. You can navigate through the pages in the report by either clicking on the pages listed below, or by using the keyword search tool below to find specific information within the annual report.-
 1
1 -
2
-
3
-
4
-
5
-
6
-
7
-
8
-
9
-
10
-
11
-
12
-
13
-
14
-
15
-
16
-
17
-
18
-
19
-
20
-
21
-
22
-
23
-
24
-
25
-
26
-
27
-
28
-
29
-
30
-
31
-
32
-
33
-
34
-
35
-
36
-
37
-
38
-
39
-
40
-
41
-
42
-
43
-
44
-
45
-
46
-
47
-
48
-
49
-
50
-
51
-
52
-
53
-
54
-
55
-
56
-
57
-
58
-
59
-
60
-
61
-
62
-
63
-
64
-
65
-
66
-
67
-
68
-
69
-
70
-
71
-
72
-
73
-
74
-
75
-
76
-
77
-
78
-
79
-
80
-
81
-
82
-
83
-
84
-
85
-
86
-
87
-
88
-
89
-
90
-
91
-
92
-
93
-
94
-
95
-
96
-
97
-
98
-
99
-
100
-
101
-
102
-
103
-
104
-
105
-
106
-
107
-
108
-
 109
109 -
 110
110 -
 111
111 -
 112
112 -
 113
113 -
 114
114 -
 115
115 -
 116
116 -
 117
117 -
 118
118 -
 119
119 -
 120
120 -
 121
121 -
 122
122 -
 123
123 -
 124
124 -
 125
125 -
 126
126 -
 127
127 -
 128
128
 |
 |

§§Ì
Notes to Consolidated Financial Statements
International Business Machines Corporation and Subsidiary Companies
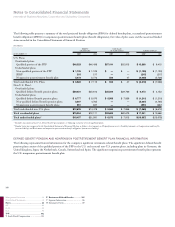
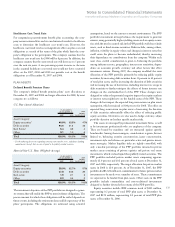
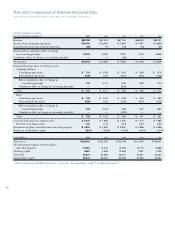
RECONCILIATIONS OF IBM AS REPORTED
($ in millions)
FOR THE YEAR ENDED DECEMBER 31: 2007 2006 2005
Revenue:
/Ó>ÑÅi°ÅÓ>LiÑÈiiÓÈÑ $105,670 $98,867 $98,572
"ÓiÅÑÅiäiÞiÑ>`Ñ>`ÞÈÓiÓÈÑ 842 637 639
>ÓÑwÑÓiÅ>ÑÅiäiÞiÑ (7,726) (8,080) (8,077)
Total IBM consolidated revenue $ 98,786 $91,424 $91,134
($ in millions)
FOR THE YEAR ENDED DECEMBER 31: 2007 2006 2005
Pre-Tax Income:
/Ó>ÑÅi°ÅÓ>LiÑÈiiÓÈÑ $15,163 $13,682 $11,485
Elimination of internal transactions (194) (171) (168)
1>V>Ói`ÑVÅ°Å>ÓiÑ>ÞÓÈÑ (480) (194) 909
Total IBM consolidated pre-tax
income from continuing operations $14,489 $13,317 $12,226
7ÓÑ °ÅiÓ>æÑ ViÑ wÅÑ VÓÞÑ °iÅ>ÓÈ]Ñ Þ>V>Ói`Ñ
VÅ°Å>ÓiÑ>ÞÓÈÑÑÛííÌÑVÞ`iÑÓiÑ>ÑwÅÑÓiÑ`äiÈÓÓÞÅiÑwÑÓiÑ
°ÅÓÑLÞÈiÈÈÑ>`ÑÓiÑÓiÅiÈÓÑiæ°iÈiÑ>ÈÈV>Ói`ÑåÓÑÓiÑVÅi-
iÓ>Ñ`iLÓÑÓÑÈÞ°°ÅÓÑÓiÑ-,ËÑÛííyÑVÞ`iÈÑÓiÑ>ÑwÅÑÓiÑÈ>iÑ
wÑÓiÑ*iÅÈ>Ñ°ÞÓÑLÞÈiÈÈÑÓÑiä]ÑÓiÑ°>VÓÑwÑÓiÑi>Ñ
ÈiÓÓiiÓÑåÓÑVÅÈwÓÑÅ°Å>Ó]Ñ°iÈÑVÞÅÓ>iÓÑÅi>Ói`Ñ
V>ÅiÈÑ>`ÑÞ>V>Ói`ÑV>ÅiÈÑÅi>Ói`ÑÓÑÓiÑÅiÈÓÅÞVÓÞÅÑ>VÓȵ
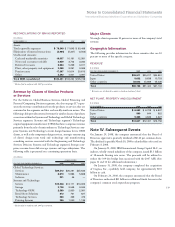
Immaterial Items
INVESTMENT IN EQUITY ALLIANCES AND
EQUITY ALLIANCES GAINS/(LOSSES)
/iÑ äiÈÓiÓÈÑ Ñ iºÞÓçÑ >>ViÈÑ >`Ñ ÓiÑ ÅiÈÞÓÑ >ÈÑ >`Ñ
²ÈÈiȳÑwÅÑÓiÈiÑäiÈÓiÓÈÑÓ>ÓÑ>ÅiÑ>ÓÓÅLÞÓ>LiÑÓÑÓiÑÈiiÓÈÑ
``ÑÓÑ>äiÑ>Ñ>ÓiÅ>ÑiwwiVÓÑÑÓiÑw>V>Ñ°ÈÓÑÅÑÓiÑw>V>Ñ
ÅiÈÞÓÈÑwÑÓiÑÈiiÓȵ
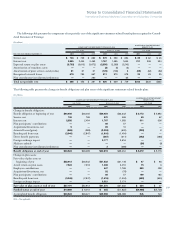
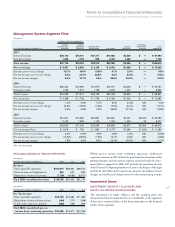
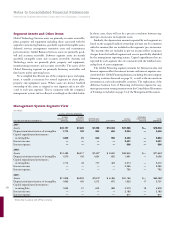
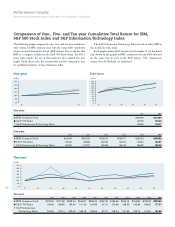
Management System Segment View
($ in millions)
GLOBAL SERVICES SEGMENTS
GLOBAL GLOBAL PERSONAL
TECHNOLOGY BUSINESS SYSTEMS AND GLOBAL COMPUTING TOTAL
FOR THE YEAR ENDED DECEMBER 31: SERVICES SERVICES TECHNOLOGY SOFTWARE FINANCING DIVISION SEGMENTS
2007:
æÓiÅ>ÑÅiäiÞiÑ $36,103 $18,041 $21,317 $19,982 $2,502 $ — $ 97,944
ÓiÅ>ÑÅiäiÞiÑ 1,636 1,193 998 2,416 1,482 — 7,726
Total revenue $37,739 $19,234 $22,315 $22,398 $3,984 $ — $105,670
Pre-tax income $ 3,557 $ 2,064 $ 2,153 $ 6,002 $1,386 $ — $ 15,163
,iäiÞiÑçi>ÅÓçi>ÅÑV>iÑ 10.7% 10.9% (3.6)% 9.7% 2.4% — 6.9%
*ÅiÓ>æÑViÑçi>ÅÓçi>ÅÑV>iÑ 8.2% 21.0% 23.8% 9.3% (4.7)% — 10.8%
*ÅiÓ>æÑViÑ>ÅÑ 9.4% 10.7% 9.6% 26.8% 34.8% — 14.3%
2006:
æÓiÅ>ÑÅiäiÞiÑ $32,322 $15,969 $21,970 $18,161 $2,365 $ — $ 90,787
ÓiÅ>ÑÅiäiÞiÑ 1,763 1,373 1,168 2,249 1,527 — 8,080
/Ó>ÑÅiäiÞi $34,086 $17,341 $23,138 $20,409 $3,892 $ — $ 98,867
Pre-tax income $ 3,288 $ 1,706 $ 1,739 $ 5,493 $1,455 $ — $ 13,682
,iäiÞiÑçi>ÅÓçi>ÅÑV>iÑ 1.4% 0.6% 4.7% 8.5% (0.4)% NM 0.3%
*ÅiÓ>æÑViÑçi>ÅÓçi>ÅÑV>iÑ 25.6% 116.9% (7.6)% 14.9% (8.1)% NM 19.1%
*ÅiÓ>æÑViÑ>ÅÑ 9.6% 9.8% 7.5% 26.9% 37.4% NM 13.8%
2005:
æÓiÅ>ÑÅiäiÞiÑ $31,501 $15,906 $20,981 $16,830 $2,401 $2,876 $ 90,495
ÓiÅ>ÑÅiäiÞiÑ 2,102 1,339 1,118 1,979 1,506 33 8,077
/Ó>ÑÅiäiÞi $33,603 $17,245 $22,099 $18,809 $3,907 $2,909 $ 98,572
*ÅiÓ>æÑViвÈȳ $ 2,619 $ 786 $ 1,883 $ 4,779 $1,583 $ (165) $ 11,485
,iäiÞiÑçi>ÅÓçi>ÅÑV>iÑ 3.5% (1.9)% 4.9% 4.8% 0.3% NM (5.0)%
*ÅiÓ>æÑViÑçi>ÅÓçi>ÅÑV>iÑ (10.9)% (28.9)% (7.9)% 19.1% 8.6% NM (0.6)%
*ÅiÓ>æÑViÑ>ÅÑ 7.8% 4.6% 8.5% 25.4% 40.5% NM 11.7%
NM — Not meaningful