IBM 2007 Annual Report Download - page 30
Download and view the complete annual report
Please find page 30 of the 2007 IBM annual report below. You can navigate through the pages in the report by either clicking on the pages listed below, or by using the keyword search tool below to find specific information within the annual report.-
 1
1 -
2
-
3
-
4
-
5
-
6
-
7
-
8
-
9
-
10
-
11
-
12
-
13
-
14
-
15
-
16
-
17
-
18
-
19
-
 20
20 -
 21
21 -
 22
22 -
 23
23 -
 24
24 -
 25
25 -
 26
26 -
 27
27 -
 28
28 -
 29
29 -
 30
30 -
 31
31 -
 32
32 -
 33
33 -
 34
34 -
 35
35 -
 36
36 -
 37
37 -
 38
38 -
 39
39 -
 40
40 -
41
-
42
-
43
-
44
-
45
-
46
-
47
-
48
-
49
-
50
-
51
-
52
-
53
-
54
-
55
-
56
-
57
-
58
-
59
-
60
-
61
-
62
-
63
-
64
-
65
-
66
-
67
-
68
-
69
-
70
-
71
-
72
-
73
-
74
-
75
-
76
-
77
-
78
-
79
-
80
-
81
-
82
-
83
-
84
-
85
-
86
-
87
-
88
-
89
-
90
-
91
-
92
-
93
-
94
-
95
-
96
-
97
-
98
-
99
-
100
-
101
-
102
-
103
-
104
-
105
-
106
-
107
-
108
-
109
-
110
-
111
-
112
-
113
-
114
-
115
-
116
-
117
-
118
-
119
-
120
-
121
-
122
-
123
-
124
-
125
-
126
-
127
-
128
 |
 |

Management Discussion
International Business Machines Corporation and Subsidiary Companies
28
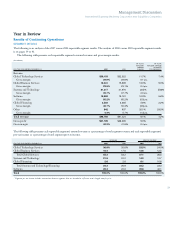
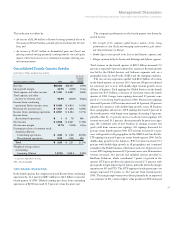
From a geographic perspective, revenue increased in all geographies
in 2007 when compared to 2006. Adjusted for currency, revenue
growth was led by Asia Pacific and steady performance throughout
the year in EMEA.
Americas’ revenue increased 4.1 percent (3 percent adjusted for
currency) in 2007. Revenue increased in all regions with the U.S. up
2.9 percent, Canada 8.4 percent (2 percent adjusted for currency) and
Latin America 8.6 percent (2 percent adjusted for currency).
EMEA revenue increased 13.8 percent (5 percent adjusted for
currency) in 2007 when compared to 2006. Within the European
market, IT spending grew at a moderate rate, and the company’s
mid single-digit revenue growth rates throughout 2007 reflected
that environment. In the major countries, Spain’s revenue grew 21.7
percent (11 percent adjusted for currency), while Germany’s revenue
increased 14.6 percent (5 percent adjusted for currency) and the
U.K.’s revenue increased 11.3 percent (3 percent adjusted for cur-
rency). France’s revenue increased 10.2 percent (1 percent adjusted
for currency) and Italy’s revenue grew 8.7 percent (decreased 1 percent
adjusted for currency).
Asia Pacific revenue increased 11.0 percent (8 percent adjusted
for currency) year over year. Growth was led by strong performance
in the India, Greater China, Australia/New Zealand, ASEAN and
Korea regions, where the economies remain strong, with combined
revenue growth of 23.8 percent (17 percent adjusted for currency).
Japan revenue, which represents 49 percent of the Asia Pacific reve-
nue base, was flat (increased 1 percent adjusted for currency) in 2007
when compared to 2006, reflecting a slower economy.
Across the geographies, the emerging BRIC countries of Brazil,
Russia, India, and China together grew 26.3 percent (18 percent
adjusted for currency), reflecting the investments made to build capa-
bilities and capture opportunities in these countries. Brazil’s revenue
increased 14.3 percent (1 percent adjusted for currency), while
Russia’s revenue grew 30.3 percent (30 percent adjusted for cur-
rency). India’s revenue increased 37.9 percent (26 percent adjusted
for currency) and China’s revenue increased 32.5 percent (29 percent
adjusted for currency). In addition to the BRIC markets, the company
has also had strong revenue growth in other nations where there is
strong demand for business and IT infrastructure solutions.
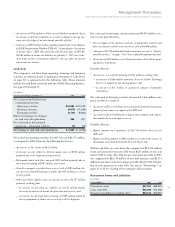
Revenue growth rates, as reported, were impacted in 2007 as a
result of the divestiture of the printing business on June 1, 2007.
Revenue, excluding the printing business in both years, increased as
follows compared to 2006:
U Americas — 5.2%
U EMEA — 14.5%
U Asia Pacific — 11.8%
U IBM Consolidated — 8.9%
The company believes that the analysis that excludes the printing
business revenues is a better indicator of operational performance on
an ongoing basis.
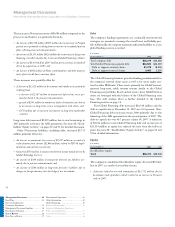
OEM revenue decreased 10.1 percent (10 percent adjusted for
currency) in 2007 when compared to 2006, driven by a slowdown in
demand for game processors.
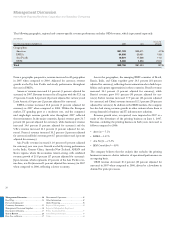
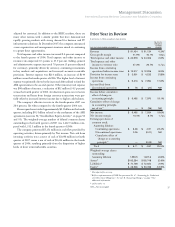
The following geographic, regional and country-specific revenue performance excludes OEM revenue, which is presented separately.
($ in millions)
YR.-TO-YR.
FOR THE YEAR ENDED DECEMBER 31: 2007 2006 CHANGE
Geographies:
Americas $41,122 $39,511 4.1%
EMEA 34,699 30,491 13.8
Asia Pacific 19,501 17,566 11.0
OEM 3,465 3,856 (10.1)
Total $98,786 $91,424 8.1%
Management Discussion ............................ 14
Road Map .........................................................14
Forward-Looking and
Cautionary Statements .....................................15
Management Discussion Snapshot ..................16
Description of Business ....................................17
Year in Review ............................................ 23
Prior Year in Review ........................................37
Discontinued Operations .................................42
Other Information ............................................42
Global Financing ..............................................50
Report of Management ....................................56
Report of Independent Registered
Public Accounting Firm ...................................57
Consolidated Statements ..................................58
Notes .................................................................64