IBM 2007 Annual Report Download - page 60
Download and view the complete annual report
Please find page 60 of the 2007 IBM annual report below. You can navigate through the pages in the report by either clicking on the pages listed below, or by using the keyword search tool below to find specific information within the annual report.-
 1
1 -
2
-
3
-
4
-
5
-
6
-
7
-
8
-
9
-
10
-
11
-
12
-
13
-
14
-
15
-
16
-
17
-
18
-
19
-
20
-
21
-
22
-
23
-
24
-
25
-
26
-
27
-
28
-
29
-
30
-
31
-
32
-
33
-
34
-
35
-
36
-
37
-
38
-
39
-
40
-
41
-
42
-
43
-
44
-
45
-
46
-
47
-
48
-
49
-
 50
50 -
 51
51 -
 52
52 -
 53
53 -
 54
54 -
 55
55 -
 56
56 -
 57
57 -
 58
58 -
 59
59 -
 60
60 -
 61
61 -
 62
62 -
 63
63 -
 64
64 -
 65
65 -
 66
66 -
 67
67 -
 68
68 -
 69
69 -
 70
70 -
71
-
72
-
73
-
74
-
75
-
76
-
77
-
78
-
79
-
80
-
81
-
82
-
83
-
84
-
85
-
86
-
87
-
88
-
89
-
90
-
91
-
92
-
93
-
94
-
95
-
96
-
97
-
98
-
99
-
100
-
101
-
102
-
103
-
104
-
105
-
106
-
107
-
108
-
109
-
110
-
111
-
112
-
113
-
114
-
115
-
116
-
117
-
118
-
119
-
120
-
121
-
122
-
123
-
124
-
125
-
126
-
127
-
128
 |
 |

58
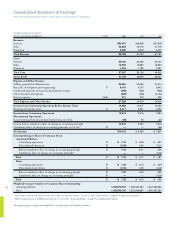
($ in millions except per share amounts)
FOR THE YEAR ENDED DECEMBER 31: NOTES 2007 2006* 2005*
Revenue:
Services $54,057 $48,328 $47,509
Sales 42,202 40,716 41,218
Financing 2,526 2,379 2,407
Total Revenue 98,786 91,424 91,134
Cost:
Services 39,160 35,065 35,151
Sales 16,552 16,882 18,360
Financing 1,345 1,182 1,091
Total Cost 57,057 53,129 54,602
Gross Profit 41,729 38,295 36,532
Expense and Other Income:
Selling, general and administrative 22,060 20,259 21,314
Research, development and engineering P 6,153 6,107 5,842
Intellectual property and custom development income (958) (900) (948)
Other (income) and expense (626) (766) (2,122)
Interest expense J&K 611 278 220
Total Expense and Other Income 27,240 24,978 24,306
Income from Continuing Operations Before Income Taxes 14,489 13,317 12,226
Provision for income taxes O 4,071 3,901 4,232
Income from Continuing Operations 10,418 9,416 7,994
Discontinued Operations:
(Loss)/earnings from discontinued operations, net of tax (00) 76 (24)
Income before cumulative effect of change in accounting principle 10,418 9,492 7,970
Cumulative effect of change in accounting principle, net of tax** B — — (36)
Net Income $10,418 $ 9,492 $ 7,934
Earnings/(loss) per Share of Common Stock:
Assuming Dilution:
Continuing operations R $ 7.18 $ 6.06 $ 4.91
Discontinued operations R (0.00) 0.05 (0.01)
Before cumulative effect of change in accounting principle R 7.18 6.11 4.90
Cumulative effect of change in accounting principle** — — (0.02)
Total R $ 7.18 $ 6.11 $ 4.87
Basic:
Continuing operations R $ 7.32 $ 6.15 $ 4.99
Discontinued operations R (0.00) 0.05 (0.02)
Before cumulative effect of change in accounting principle R 7.32 6.20 4.98
Cumulative effect of change in accounting principle** R — — (0.02)
Total R $ 7.32 $ 6.20 $ 4.96
Weighted-Average Number of Common Shares Outstanding:
Assuming dilution 1,450,570,579 1,553,535,384 1,627,632,662
Basic 1,423,039,793 1,530,806,987 1,600,591,264
* Reclassified to conform with 2007 presentation of new Revenue and Cost categories. See note A, “Basis of Presentation,” on page 64 for additional information.
** Reflects implementation of FASB Interpretation No. 47. See note B, “Accounting Changes,” on page 75 for additional information.
The accompanying notes on pages 64 through 119 are an integral part of the financial statements.
Consolidated Statement of Earnings
International Business Machines Corporation and Subsidiary Companies