IBM 2007 Annual Report Download - page 19
Download and view the complete annual report
Please find page 19 of the 2007 IBM annual report below. You can navigate through the pages in the report by either clicking on the pages listed below, or by using the keyword search tool below to find specific information within the annual report.-
 1
1 -
2
-
3
-
4
-
5
-
6
-
7
-
8
-
 9
9 -
 10
10 -
 11
11 -
 12
12 -
 13
13 -
 14
14 -
 15
15 -
 16
16 -
 17
17 -
 18
18 -
 19
19 -
 20
20 -
 21
21 -
 22
22 -
 23
23 -
 24
24 -
 25
25 -
 26
26 -
 27
27 -
 28
28 -
 29
29 -
30
-
31
-
32
-
33
-
34
-
35
-
36
-
37
-
38
-
39
-
40
-
41
-
42
-
43
-
44
-
45
-
46
-
47
-
48
-
49
-
50
-
51
-
52
-
53
-
54
-
55
-
56
-
57
-
58
-
59
-
60
-
61
-
62
-
63
-
64
-
65
-
66
-
67
-
68
-
69
-
70
-
71
-
72
-
73
-
74
-
75
-
76
-
77
-
78
-
79
-
80
-
81
-
82
-
83
-
84
-
85
-
86
-
87
-
88
-
89
-
90
-
91
-
92
-
93
-
94
-
95
-
96
-
97
-
98
-
99
-
100
-
101
-
102
-
103
-
104
-
105
-
106
-
107
-
108
-
109
-
110
-
111
-
112
-
113
-
114
-
115
-
116
-
117
-
118
-
119
-
120
-
121
-
122
-
123
-
124
-
125
-
126
-
127
-
128
 |
 |
Management Discussion
International Business Machines Corporation and Subsidiary Companies
17
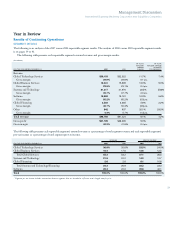
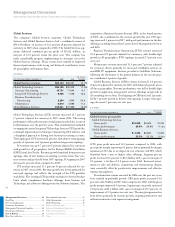
The consolidated gross profit margin increased 0.4 points versus
2006 to 42.2 percent. An improvement in the Systems and Technology
margin (2.0 points) contributed 0.5 points to the overall margin
improvement. This increase was primarily driven by higher margins
in System z, System p and System x servers. The Software margin
was flat at 85.2 percent, but contributed 0.2 points to the overall
margin improvement due to the mix of revenue by segment. The
Global Technology Services and Global Business Services margins
increased 0.1 points and 0.4 points to 29.9 percent and 23.5 percent,
respectively, versus the prior year. Although gross profit margins
improved for Global Services, the increased Global Services revenue
content contributed to a 0.2 point decline in the consolidated gross
margin due to the mix impact. The Global Finan cing margin declined
3.5 points versus 2006 to 46.7 percent, causing a 0.1 point decline in
the overall company margin.
Total expense and other income increased 9.1 percent (5 percent
adjusted for currency) in 2007 versus 2006. The increase was primar-
ily due to increases in Selling, general and administrative (SG&A)
expense and Interest expense. SG&A expense increased $1,801 million
primarily due to acquisition related spending, as well as increased
investments in emerging countries and the software and services
businesses. Interest expense increased $333 million primarily due to
higher debt associated with the financing of the ASR. In addition,
Other (income) and expense declined $140 million in income year-
to-year primarily due to higher losses on derivative instruments.
The effective tax rate for 2007 was 28.1 percent, compared with
29.3 percent in 2006.
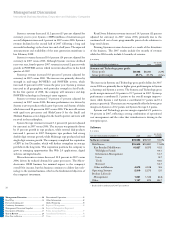
Total assets increased $17,197 million ($12,957 million adjusted
for currency) primarily due to increases in Cash and cash equivalents
($6,969 million), Prepaid pension assets ($6,788 million), total
financing receivables ($2,729 million) and Goodwill ($1,431 million).
These increases were partially offset by decreases in long-term
deferred tax assets ($2,367 million) and short-term marketable secu-
rities ($1,479 million).
Total liabilities increased $17,234 million ($13,642 million adjusted
for currency) driven primarily by increases in total debt ($12,592
million), tax liabilities ($1,492 million) and total deferred income
($1,773 million).
Stockholders’ equity of $28,470 million was essentially flat
versus 2006. Increased Treasury stock ($17,649 million) from
share repurchases, which included the ASR, was largely offset
by increased Retained earnings ($8,208 million) driven by Net
income, increased Common stock ($3,917 million) related to stock
options and a decline in Accumulated gains and (losses) not affect-
ing retained earnings ($5,487 million) primarily due to the effects
of pension remeasurements.
The company generated $16,094 million in cash flow provided by
operating activities, an increase of $1,075 million compared to 2006,
primarily driven by increased Net income. Net cash used in investing
activities of $4,675 million was $6,874 million lower than 2006
driven primarily by proceeds from disposition of short-term market-
able securities and a reduction in cash used for acquisitions. Net cash
used in financing activities of $4,740 million decreased $3,464 million
versus 2006 driven by increased net proceeds from total debt
($12,233 million), partially offset by increased share repurchases
($10,744 million).
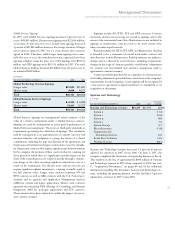
Global Services signings were $50 billion in 2007 as compared to
$49 billion in 2006. The Global Services backlog is estimated to be
$118 billion at December 31, 2007, versus $116 billion at December
31, 2006.
For additional information and details, see the “Year in Review”
section on pages 23 to 37.
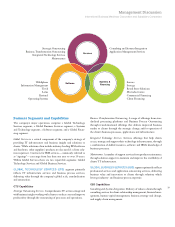
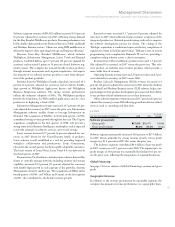
Description of Business
Please refer to IBM’s Annual Report on Form 10-K filed on February 26,
2008, with the SEC for a more detailed version of this Description of
Business, especially Item 1A. entitled “Risk Factors.”
IBM is a globally integrated enterprise that targets the intersection of
technology and effective business. The company seeks to be a partner
in its clients’ success by enabling their own capacity for distinctive
innovation. To help clients achieve growth, effectiveness, efficiency
and the realization of greater value through innovation, IBM draws
upon the world’s leading systems, software and services capabilities.