HP 2013 Annual Report Download - page 88
Download and view the complete annual report
Please find page 88 of the 2013 HP annual report below. You can navigate through the pages in the report by either clicking on the pages listed below, or by using the keyword search tool below to find specific information within the annual report.-
 1
1 -
2
-
3
-
4
-
5
-
6
-
7
-
8
-
9
-
10
-
11
-
12
-
13
-
14
-
15
-
16
-
17
-
18
-
19
-
20
-
21
-
22
-
23
-
24
-
25
-
26
-
27
-
28
-
29
-
30
-
31
-
32
-
33
-
34
-
35
-
36
-
37
-
38
-
39
-
40
-
41
-
42
-
43
-
44
-
45
-
46
-
47
-
48
-
49
-
50
-
51
-
52
-
53
-
54
-
55
-
56
-
57
-
58
-
59
-
60
-
61
-
62
-
63
-
64
-
65
-
66
-
67
-
68
-
69
-
70
-
71
-
72
-
73
-
74
-
75
-
76
-
77
-
 78
78 -
 79
79 -
 80
80 -
 81
81 -
 82
82 -
 83
83 -
 84
84 -
 85
85 -
 86
86 -
 87
87 -
 88
88 -
 89
89 -
 90
90 -
 91
91 -
 92
92 -
 93
93 -
 94
94 -
 95
95 -
 96
96 -
 97
97 -
 98
98 -
99
-
100
-
101
-
102
-
103
-
104
-
105
-
106
-
107
-
108
-
109
-
110
-
111
-
112
-
113
-
114
-
115
-
116
-
117
-
118
-
119
-
120
-
121
-
122
-
123
-
124
-
125
-
126
-
127
-
128
-
129
-
130
-
131
-
132
-
133
-
134
-
135
-
136
-
137
-
138
-
139
-
140
-
141
-
142
-
143
-
144
-
145
-
146
-
147
-
148
-
149
-
150
-
151
-
152
-
153
-
154
-
155
-
156
-
157
-
158
-
159
-
160
-
161
-
162
-
163
-
164
-
165
-
166
-
167
-
168
-
169
-
170
-
171
-
172
-
173
-
174
-
175
-
176
-
177
-
178
-
179
-
180
-
181
-
182
-
183
-
184
-
185
-
186
-
187
-
188
-
189
-
190
-
191
-
192
-
193
-
194
-
195
-
196
-
197
-
198
-
199
-
200
-
201
-
202
-
203
-
204
 |
 |

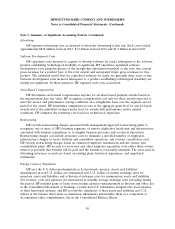
HEWLETT-PACKARD COMPANY AND SUBSIDIARIES
Consolidated Statements of Earnings
For the fiscal years ended October 31
2013 2012 2011
In millions, except per share amounts
Net revenue:
Products ........................................... $ 72,398 $ 77,887 $ 84,757
Services ............................................ 39,453 42,008 42,039
Financing income ..................................... 447 462 449
Total net revenue ................................... 112,298 120,357 127,245
Costs and expenses:
Cost of products ..................................... 55,632 59,468 65,167
Cost of services ...................................... 30,436 32,600 31,945
Financing interest .................................... 312 317 306
Research and development .............................. 3,135 3,399 3,254
Selling, general and administrative ........................ 13,267 13,500 13,577
Amortization of intangible assets ......................... 1,373 1,784 1,607
Impairment of goodwill and intangible assets ................. — 18,035 885
Restructuring charges .................................. 990 2,266 645
Acquisition-related charges .............................. 22 45 182
Total operating expenses .............................. 105,167 131,414 117,568
Earnings (loss) from operations ............................ 7,131 (11,057) 9,677
Interest and other, net ................................... (621) (876) (695)
Earnings (loss) before taxes ............................... 6,510 (11,933) 8,982
Provision for taxes ...................................... (1,397) (717) (1,908)
Net earnings (loss) ..................................... $ 5,113 $ (12,650) $ 7,074
Net earnings (loss) per share:
Basic .............................................. $ 2.64 $ (6.41) $ 3.38
Diluted ............................................ $ 2.62 $ (6.41) $ 3.32
Weighted-average shares used to compute net earnings (loss) per
share:
Basic .............................................. 1,934 1,974 2,094
Diluted ............................................ 1,950 1,974 2,128
The accompanying notes are an integral part of these Consolidated Financial Statements.
80