HP 2013 Annual Report Download - page 77
Download and view the complete annual report
Please find page 77 of the 2013 HP annual report below. You can navigate through the pages in the report by either clicking on the pages listed below, or by using the keyword search tool below to find specific information within the annual report.-
 1
1 -
2
-
3
-
4
-
5
-
6
-
7
-
8
-
9
-
10
-
11
-
12
-
13
-
14
-
15
-
16
-
17
-
18
-
19
-
20
-
21
-
22
-
23
-
24
-
25
-
26
-
27
-
28
-
29
-
30
-
31
-
32
-
33
-
34
-
35
-
36
-
37
-
38
-
39
-
40
-
41
-
42
-
43
-
44
-
45
-
46
-
47
-
48
-
49
-
50
-
51
-
52
-
53
-
54
-
55
-
56
-
57
-
58
-
59
-
60
-
61
-
62
-
63
-
64
-
65
-
66
-
 67
67 -
 68
68 -
 69
69 -
 70
70 -
 71
71 -
 72
72 -
 73
73 -
 74
74 -
 75
75 -
 76
76 -
 77
77 -
 78
78 -
 79
79 -
 80
80 -
 81
81 -
 82
82 -
 83
83 -
 84
84 -
 85
85 -
 86
86 -
 87
87 -
88
-
89
-
90
-
91
-
92
-
93
-
94
-
95
-
96
-
97
-
98
-
99
-
100
-
101
-
102
-
103
-
104
-
105
-
106
-
107
-
108
-
109
-
110
-
111
-
112
-
113
-
114
-
115
-
116
-
117
-
118
-
119
-
120
-
121
-
122
-
123
-
124
-
125
-
126
-
127
-
128
-
129
-
130
-
131
-
132
-
133
-
134
-
135
-
136
-
137
-
138
-
139
-
140
-
141
-
142
-
143
-
144
-
145
-
146
-
147
-
148
-
149
-
150
-
151
-
152
-
153
-
154
-
155
-
156
-
157
-
158
-
159
-
160
-
161
-
162
-
163
-
164
-
165
-
166
-
167
-
168
-
169
-
170
-
171
-
172
-
173
-
174
-
175
-
176
-
177
-
178
-
179
-
180
-
181
-
182
-
183
-
184
-
185
-
186
-
187
-
188
-
189
-
190
-
191
-
192
-
193
-
194
-
195
-
196
-
197
-
198
-
199
-
200
-
201
-
202
-
203
-
204
 |
 |

HEWLETT-PACKARD COMPANY AND SUBSIDIARIES
Management’s Discussion and Analysis of
Financial Condition and Results of Operations (Continued)
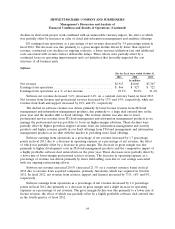
Operating Activities
Net cash provided by operating activities increased by $1.0 billion for fiscal 2013 as compared to
fiscal 2012. The increase was due primarily to the impact of improved payment terms from suppliers
and a reduction in payments associated with webOS contract cancellations, the impact of which was
partially offset due to higher cash utilization in inventory. Net cash provided by operating activities
decreased by $2.1 billion for fiscal 2012 as compared to fiscal 2011. The decrease was due primarily to
lower net earnings and higher utilization of cash resources for payment of accounts payable, the impact
of which was partially offset by lower investments in inventory and higher cash generated from
collections of accounts and financing receivables.
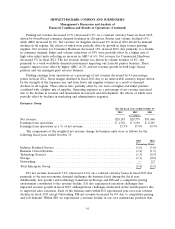
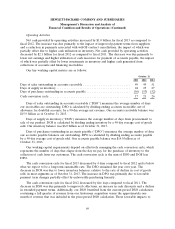
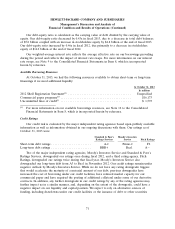
Our key working capital metrics are as follows:
October 31
2013 2012 2011
Days of sales outstanding in accounts receivable ........................... 49 49 51
Days of supply in inventory .......................................... 24 25 27
Days of purchases outstanding in accounts payable ......................... (56) (53) (52)
Cash conversion cycle .............................................. 17 21 26
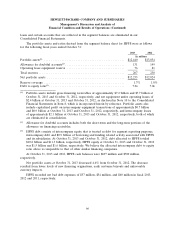
Days of sales outstanding in accounts receivable (‘‘DSO’’) measures the average number of days
our receivables are outstanding. DSO is calculated by dividing ending accounts receivable, net of
allowance for doubtful accounts, by a 90-day average net revenue. Our accounts receivable balance was
$15.9 billion as of October 31, 2013.
Days of supply in inventory (‘‘DOS’’) measures the average number of days from procurement to
sale of our product. DOS is calculated by dividing ending inventory by a 90-day average cost of goods
sold. Our inventory balance was $6.0 billion as of October 31, 2013.
Days of purchases outstanding in accounts payable (‘‘DPO’’) measures the average number of days
our accounts payable balances are outstanding. DPO is calculated by dividing ending accounts payable
by a 90-day average cost of goods sold. Our accounts payable balance was $14.0 billion as of
October 31, 2013.
Our working capital requirements depend on effectively managing the cash conversion cycle, which
represents the number of days that elapse from the day we pay for the purchase of inventory to the
collection of cash from our customers. The cash conversion cycle is the sum of DSO and DOS less
DPO.
The cash conversion cycle for fiscal 2013 decreased by 4 days compared to fiscal 2012 and is below
what we expect to be a long-term sustainable rate. The DSO remained flat year over year. The
decrease in DOS was due to lower inventory balances, relative to the rate of decline in cost of goods
sold, in most segments as of October 31, 2013. The increase in DPO was primarily due to favorable
payment term changes partially offset by unfavorable purchasing linearity.
The cash conversion cycle for fiscal 2012 decreased by five days compared to fiscal 2011. The
decrease in DSO was due primarily to improved collections, an increase in cash discounts and a decline
in extended payment terms. Additionally, our DSO benefited from the current-period DSO calculation
containing a full quarter of revenue from our Autonomy acquisition versus the approximately one
month of revenue that was included in the prior-period DSO calculation. These favorable impacts to
69