HP 2013 Annual Report Download - page 152
Download and view the complete annual report
Please find page 152 of the 2013 HP annual report below. You can navigate through the pages in the report by either clicking on the pages listed below, or by using the keyword search tool below to find specific information within the annual report.-
 1
1 -
2
-
3
-
4
-
5
-
6
-
7
-
8
-
9
-
10
-
11
-
12
-
13
-
14
-
15
-
16
-
17
-
18
-
19
-
20
-
21
-
22
-
23
-
24
-
25
-
26
-
27
-
28
-
29
-
30
-
31
-
32
-
33
-
34
-
35
-
36
-
37
-
38
-
39
-
40
-
41
-
42
-
43
-
44
-
45
-
46
-
47
-
48
-
49
-
50
-
51
-
52
-
53
-
54
-
55
-
56
-
57
-
58
-
59
-
60
-
61
-
62
-
63
-
64
-
65
-
66
-
67
-
68
-
69
-
70
-
71
-
72
-
73
-
74
-
75
-
76
-
77
-
78
-
79
-
80
-
81
-
82
-
83
-
84
-
85
-
86
-
87
-
88
-
89
-
90
-
91
-
92
-
93
-
94
-
95
-
96
-
97
-
98
-
99
-
100
-
101
-
102
-
103
-
104
-
105
-
106
-
107
-
108
-
109
-
110
-
111
-
112
-
113
-
114
-
115
-
116
-
117
-
118
-
119
-
120
-
121
-
122
-
123
-
124
-
125
-
126
-
127
-
128
-
129
-
130
-
131
-
132
-
133
-
134
-
135
-
136
-
137
-
138
-
139
-
140
-
141
-
 142
142 -
 143
143 -
 144
144 -
 145
145 -
 146
146 -
 147
147 -
 148
148 -
 149
149 -
 150
150 -
 151
151 -
 152
152 -
 153
153 -
 154
154 -
 155
155 -
 156
156 -
 157
157 -
 158
158 -
 159
159 -
 160
160 -
 161
161 -
 162
162 -
163
-
164
-
165
-
166
-
167
-
168
-
169
-
170
-
171
-
172
-
173
-
174
-
175
-
176
-
177
-
178
-
179
-
180
-
181
-
182
-
183
-
184
-
185
-
186
-
187
-
188
-
189
-
190
-
191
-
192
-
193
-
194
-
195
-
196
-
197
-
198
-
199
-
200
-
201
-
202
-
203
-
204
 |
 |

HEWLETT-PACKARD COMPANY AND SUBSIDIARIES
Notes to Consolidated Financial Statements (Continued)
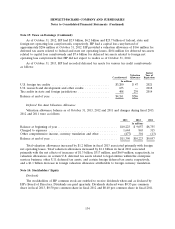
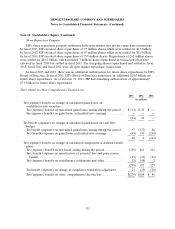
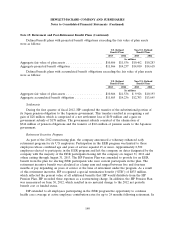
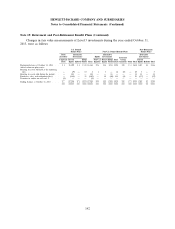
Note 15: Retirement and Post-Retirement Benefit Plans (Continued)
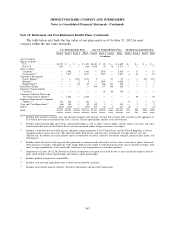
Changes in fair value measurements of Level 3 investments during the year ended October 31,
2012, were as follows:
Post-Retirement
U.S. Defined Benefit Plans Non-U.S. Defined Benefit Plans Benefit Plans
Debt Alternative Debt Alternative Alternative
Securities Investments Equity Securities Investments Investments
Insurance
Corporate Private Hedge U.S. Non U.S. Corporate Private Hedge Real Group Private
Debt Equity Hybrids Funds Total Equities Equities Debt Equity Funds Estate Annuities Cash Other Total Equity Hybrids Total
In millions
Beginning balance at
October 31, 2011 . . . . $— $1,356 $ 4 $— $1,360 $ 30 $— $ 3 $ 20 $300 $199 $89 $(4) $ 19 $656 $227 $ 1 $228
Actual return on plan
assets:
Relating to assets still
held at the reporting
date . . . . . . . . . . — (67) (1) — (68) (2) — (1) (1) (76) (5) 1 — (1) (85) 13 — 13
Relating to assets sold
during the period . . . — 103 1 — 104 — — — — — — — — — — 3 — 3
Purchases, sales, and
settlements (net) . . . . 1 (92) (2) 65 (28) — — (2) 16 — 43 (2) — — 55 (8) — (8)
Transfers in and/or out of
Level 3 ......... — — — — — (28) 76 — (14) 9 (43) — 4 (16) (12) — — —
Ending balance at
October 31, 2012 . . . . $ 1 $1,300 $ 2 $65 $1,368 $ — $76 $— $ 21 $233 $194 $88 $— $ 2 $614 $235 $ 1 $236
The following is a description of the valuation methodologies used for plan assets measured at fair
value. There have been no changes in the methodologies used during the reporting period.
Investments in publicly-traded equity securities are valued using the closing price on the
measurement date as reported on the stock exchange on which the individual securities are traded. For
corporate, government and asset-backed debt securities, fair value is based upon observable inputs of
comparable market transactions. For corporate and government debt securities traded on active
exchanges, fair value is based upon observable quoted prices. The valuation of alternative investments,
such as limited partnerships and joint ventures, may require significant management judgment. For
alternative investments, valuation is based on net asset value (‘‘NAV’’) as reported by the asset
manager and is adjusted when management determines that NAV is not representative of fair value. In
making such an assessment, a variety of factors are reviewed by management, including, but not limited
to, the timeliness of NAV as reported by the asset manager and changes in general economic and
market conditions subsequent to the last NAV reported by the asset manager. Depending on the
amount of management judgment, the lack of near-term liquidity, and the absence of quoted market
prices, these assets are classified in Level 2 or Level 3 of the fair value hierarchy. Further, depending
on how quickly HP can redeem its hedge fund investments, and the extent of any adjustments to NAV,
hedge funds are classified within either Level 2 or Level 3 of the fair value hierarchy. Common
collective trusts, interest in 103-12 entities and registered investment companies are valued at NAV. The
valuation for some of these assets requires judgment due to the absence of quoted market prices, and
these assets are generally classified in Level 2 of the fair value hierarchy. Cash and cash equivalents
includes money market funds, which are valued based on NAV. Other assets were classified in the fair
value hierarchy based on the lowest level input (e.g., quoted prices and observable inputs) that is
significant to the fair value measure in its entirety.
144