HP 2013 Annual Report Download - page 67
Download and view the complete annual report
Please find page 67 of the 2013 HP annual report below. You can navigate through the pages in the report by either clicking on the pages listed below, or by using the keyword search tool below to find specific information within the annual report.-
 1
1 -
2
-
3
-
4
-
5
-
6
-
7
-
8
-
9
-
10
-
11
-
12
-
13
-
14
-
15
-
16
-
17
-
18
-
19
-
20
-
21
-
22
-
23
-
24
-
25
-
26
-
27
-
28
-
29
-
30
-
31
-
32
-
33
-
34
-
35
-
36
-
37
-
38
-
39
-
40
-
41
-
42
-
43
-
44
-
45
-
46
-
47
-
48
-
49
-
50
-
51
-
52
-
53
-
54
-
55
-
56
-
 57
57 -
 58
58 -
 59
59 -
 60
60 -
 61
61 -
 62
62 -
 63
63 -
 64
64 -
 65
65 -
 66
66 -
 67
67 -
 68
68 -
 69
69 -
 70
70 -
 71
71 -
 72
72 -
 73
73 -
 74
74 -
 75
75 -
 76
76 -
 77
77 -
78
-
79
-
80
-
81
-
82
-
83
-
84
-
85
-
86
-
87
-
88
-
89
-
90
-
91
-
92
-
93
-
94
-
95
-
96
-
97
-
98
-
99
-
100
-
101
-
102
-
103
-
104
-
105
-
106
-
107
-
108
-
109
-
110
-
111
-
112
-
113
-
114
-
115
-
116
-
117
-
118
-
119
-
120
-
121
-
122
-
123
-
124
-
125
-
126
-
127
-
128
-
129
-
130
-
131
-
132
-
133
-
134
-
135
-
136
-
137
-
138
-
139
-
140
-
141
-
142
-
143
-
144
-
145
-
146
-
147
-
148
-
149
-
150
-
151
-
152
-
153
-
154
-
155
-
156
-
157
-
158
-
159
-
160
-
161
-
162
-
163
-
164
-
165
-
166
-
167
-
168
-
169
-
170
-
171
-
172
-
173
-
174
-
175
-
176
-
177
-
178
-
179
-
180
-
181
-
182
-
183
-
184
-
185
-
186
-
187
-
188
-
189
-
190
-
191
-
192
-
193
-
194
-
195
-
196
-
197
-
198
-
199
-
200
-
201
-
202
-
203
-
204
 |
 |

HEWLETT-PACKARD COMPANY AND SUBSIDIARIES
Management’s Discussion and Analysis of
Financial Condition and Results of Operations (Continued)
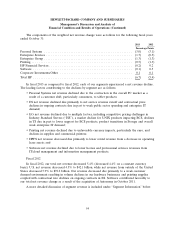
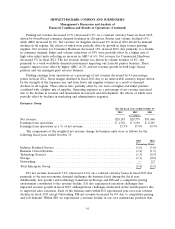
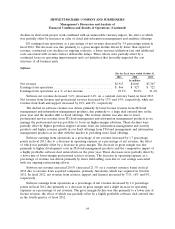
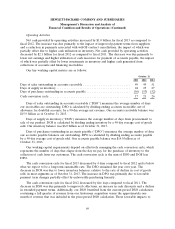
The components of the weighted net revenue change by Personal Systems business units were as
follows for the following fiscal years ended October 31:
2013 2012
Percentage Points
Notebook PCs .................................................... (7.8) (6.3)
Desktop PCs ..................................................... (2.9) (3.4)
Workstations ..................................................... — (0.2)
Other .......................................................... 0.5 —
Total Personal Systems .............................................. (10.2) (9.9)
Personal Systems net revenue decreased 10.2% (decreased 9.0% on a constant currency basis) in
fiscal 2013. The Personal Systems business continues to experience significant challenges due to the
overall PC market contraction as a result of a customer shift, particularly consumers, to tablet products.
The business is also experiencing broad-based regional demand weakness, particularly in the EMEA
region. The decline in Personal Systems revenue was driven by an 8% decline in unit volume along
with a 3% decline in average selling prices (‘‘ASPs’’). The unit volume decrease was led by declines in
consumer and notebook products as a result of the market shift to tablet products. The decline in ASPs
was due primarily to a competitive pricing environment. Net revenue for consumer clients decreased
19%, while net revenue for commercial clients decreased 4%. Notebook PCs net revenue decreased
15%, while Desktop PCs net revenue decreased 8%. Workstations net revenue growth was flat, while
Other net revenue increased 22%. The net revenue increase in Other was related to increased sales of
extended warranties and third-party branded options and sales of our newly introduced consumer
tablets.
Personal Systems earnings from operations as a percentage of net revenue decreased
1.7 percentage points in fiscal 2013. The decrease was driven by a decline in gross margin combined
with an increase in operating expenses as a percentage of net revenue. The decline in gross margin was
due to unfavorable currency impacts and competitive pricing pressures. These unfavorable impacts to
gross margin were partially offset by lower component and warranty costs and a favorable mix of
higher-margin commercial products. Operating expenses as a percentage of net revenue increased due
primarily to the size of the revenue decline as well as slightly higher R&D costs. However, operating
expenses declined across most other expense categories as a result of our ongoing restructuring efforts.
Personal Systems net revenue decreased 9.9% (decreased 8.8% on a constant currency basis) in
fiscal 2012. The revenue decline was due primarily to a decline in unit volumes, the effect of which was
partially offset by a nominal increase in ASPs. ASPs increased due primarily to a mix shift toward
higher-end models, the effect of which was partially offset by unfavorable currency impacts. Unit
volume was down 11% due primarily to continued demand weakness in both the consumer and
commercial markets. In fiscal 2012, net revenue from Notebook PCs decreased 12% while net revenue
from Desktop PCs decreased 9% as a result of the overall market decline. Workstations revenue
decreased 3% due to weak demand in the commercial PC market. In fiscal 2012, net revenue for
consumer clients decreased 15% while commercial client revenue decreased 6%.
Personal Systems earnings from operations as a percentage of net revenue decreased
1.2 percentage points in fiscal 2012. The decrease was due primarily to a gross margin decline resulting
from higher component costs combined with an unfavorable currency impact. These negative impacts to
gross margin were partially offset by lower warranty and logistics costs, benefits from insurance
proceeds related to flooding in Thailand in July 2011 and an increased level of component vendor
59