HP 2013 Annual Report Download - page 74
Download and view the complete annual report
Please find page 74 of the 2013 HP annual report below. You can navigate through the pages in the report by either clicking on the pages listed below, or by using the keyword search tool below to find specific information within the annual report.-
 1
1 -
2
-
3
-
4
-
5
-
6
-
7
-
8
-
9
-
10
-
11
-
12
-
13
-
14
-
15
-
16
-
17
-
18
-
19
-
20
-
21
-
22
-
23
-
24
-
25
-
26
-
27
-
28
-
29
-
30
-
31
-
32
-
33
-
34
-
35
-
36
-
37
-
38
-
39
-
40
-
41
-
42
-
43
-
44
-
45
-
46
-
47
-
48
-
49
-
50
-
51
-
52
-
53
-
54
-
55
-
56
-
57
-
58
-
59
-
60
-
61
-
62
-
63
-
 64
64 -
 65
65 -
 66
66 -
 67
67 -
 68
68 -
 69
69 -
 70
70 -
 71
71 -
 72
72 -
 73
73 -
 74
74 -
 75
75 -
 76
76 -
 77
77 -
 78
78 -
 79
79 -
 80
80 -
 81
81 -
 82
82 -
 83
83 -
 84
84 -
85
-
86
-
87
-
88
-
89
-
90
-
91
-
92
-
93
-
94
-
95
-
96
-
97
-
98
-
99
-
100
-
101
-
102
-
103
-
104
-
105
-
106
-
107
-
108
-
109
-
110
-
111
-
112
-
113
-
114
-
115
-
116
-
117
-
118
-
119
-
120
-
121
-
122
-
123
-
124
-
125
-
126
-
127
-
128
-
129
-
130
-
131
-
132
-
133
-
134
-
135
-
136
-
137
-
138
-
139
-
140
-
141
-
142
-
143
-
144
-
145
-
146
-
147
-
148
-
149
-
150
-
151
-
152
-
153
-
154
-
155
-
156
-
157
-
158
-
159
-
160
-
161
-
162
-
163
-
164
-
165
-
166
-
167
-
168
-
169
-
170
-
171
-
172
-
173
-
174
-
175
-
176
-
177
-
178
-
179
-
180
-
181
-
182
-
183
-
184
-
185
-
186
-
187
-
188
-
189
-
190
-
191
-
192
-
193
-
194
-
195
-
196
-
197
-
198
-
199
-
200
-
201
-
202
-
203
-
204
 |
 |

HEWLETT-PACKARD COMPANY AND SUBSIDIARIES
Management’s Discussion and Analysis of
Financial Condition and Results of Operations (Continued)
loans and certain accounts that are reflected in the segment balances are eliminated in our
Consolidated Financial Statements.
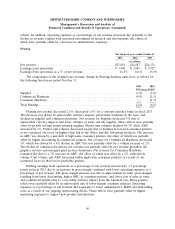
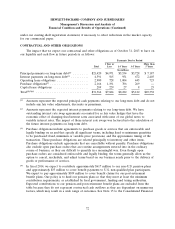
The portfolio assets and ratios derived from the segment balance sheet for HPFS were as follows
for the following fiscal years ended October 31:
2013 2012
In millions
Portfolio assets(1) .............................................. $12,440 $13,054
Allowance for doubtful accounts(2) .................................. 131 149
Operating lease equipment reserve ................................. 76 81
Total reserves ................................................. 207 230
Net portfolio assets ............................................ $12,233 $12,824
Reserve coverage .............................................. 1.7% 1.8%
Debt to equity ratio(3) ........................................... 7.0x 7.0x
(1) Portfolio assets include gross financing receivables of approximately $7.2 billion and $7.7 billion at
October 31, 2013 and October 31, 2012, respectively, and net equipment under operating leases of
$2.4 billion at October 31, 2013 and October 31, 2012, as disclosed in Note 10 to the Consolidated
Financial Statements in Item 8, which is incorporated herein by reference. Portfolio assets also
include capitalized profit on intercompany equipment transactions of approximately $0.7 billion
and $0.9 billion at October 31, 2013 and October 31, 2012, respectively, and intercompany leases
of approximately $2.1 billion at October 31, 2013 and October 31, 2012, respectively, both of which
are eliminated in consolidation.
(2) Allowance for doubtful accounts includes both the short-term and the long-term portions of the
allowance on financing receivables.
(3) HPFS debt consists of intercompany equity that is treated as debt for segment reporting purposes,
intercompany debt and $0.9 billion of borrowing and funding related activity associated with HPFS
and its subsidiaries. At October 31, 2013 and October 31, 2012, debt allocated to HPFS totaled
$10.8 billion and $11.3 billion, respectively. HPFS equity at October 31, 2013 and October 31, 2012
was $1.5 billion and $1.6 billion, respectively. We believe the allocated intercompany debt to equity
ratio above is comparable to that of other similar financing companies.
At October 31, 2013 and 2012, HPFS cash balances were $697 million and $700 million,
respectively.
Net portfolio assets at October 31, 2013 decreased 4.6% from October 31, 2012. The decrease
resulted from lower levels of new financing originations, early customer buyouts and unfavorable
currency impacts.
HPFS recorded net bad debt expenses of $57 million, $54 million, and $60 million in fiscal 2013,
2012 and 2011, respectively.
66