HP 2013 Annual Report Download - page 54
Download and view the complete annual report
Please find page 54 of the 2013 HP annual report below. You can navigate through the pages in the report by either clicking on the pages listed below, or by using the keyword search tool below to find specific information within the annual report.-
 1
1 -
2
-
3
-
4
-
5
-
6
-
7
-
8
-
9
-
10
-
11
-
12
-
13
-
14
-
15
-
16
-
17
-
18
-
19
-
20
-
21
-
22
-
23
-
24
-
25
-
26
-
27
-
28
-
29
-
30
-
31
-
32
-
33
-
34
-
35
-
36
-
37
-
38
-
39
-
40
-
41
-
42
-
43
-
 44
44 -
 45
45 -
 46
46 -
 47
47 -
 48
48 -
 49
49 -
 50
50 -
 51
51 -
 52
52 -
 53
53 -
 54
54 -
 55
55 -
 56
56 -
 57
57 -
 58
58 -
 59
59 -
 60
60 -
 61
61 -
 62
62 -
 63
63 -
 64
64 -
65
-
66
-
67
-
68
-
69
-
70
-
71
-
72
-
73
-
74
-
75
-
76
-
77
-
78
-
79
-
80
-
81
-
82
-
83
-
84
-
85
-
86
-
87
-
88
-
89
-
90
-
91
-
92
-
93
-
94
-
95
-
96
-
97
-
98
-
99
-
100
-
101
-
102
-
103
-
104
-
105
-
106
-
107
-
108
-
109
-
110
-
111
-
112
-
113
-
114
-
115
-
116
-
117
-
118
-
119
-
120
-
121
-
122
-
123
-
124
-
125
-
126
-
127
-
128
-
129
-
130
-
131
-
132
-
133
-
134
-
135
-
136
-
137
-
138
-
139
-
140
-
141
-
142
-
143
-
144
-
145
-
146
-
147
-
148
-
149
-
150
-
151
-
152
-
153
-
154
-
155
-
156
-
157
-
158
-
159
-
160
-
161
-
162
-
163
-
164
-
165
-
166
-
167
-
168
-
169
-
170
-
171
-
172
-
173
-
174
-
175
-
176
-
177
-
178
-
179
-
180
-
181
-
182
-
183
-
184
-
185
-
186
-
187
-
188
-
189
-
190
-
191
-
192
-
193
-
194
-
195
-
196
-
197
-
198
-
199
-
200
-
201
-
202
-
203
-
204
 |
 |
HEWLETT-PACKARD COMPANY AND SUBSIDIARIES
Management’s Discussion and Analysis of
Financial Condition and Results of Operations (Continued)
perpetual software licenses at the inception of the license term, assuming all revenue recognition
criteria have been met. Term-based software license revenue is generally recognized ratably over the
term of the license. For software products within the scope of the software accounting guidance, we use
the residual method to allocate revenue to software licenses at the inception of the license term when
VSOE of fair value for all undelivered elements exists, such as post-contract support, and all other
revenue recognition criteria have been satisfied. Revenue generated from maintenance and unspecified
upgrades or updates on an if-and-when-available basis is recognized ratably over the period during
which such items are delivered. For software hosting or SaaS arrangements, we recognize revenue as
the service is delivered, generally on a straight-line basis, over the contractual period of performance.
In software hosting arrangements where software licenses are sold, the associated software revenue is
generally recognized according to whether perpetual licenses or term licenses are sold, subject to the
above guidance. In such software hosting arrangements, we consider the rights provided to the
customer (e.g., ownership of a license, contract termination provisions and feasibility of the customer to
operate the software) in determining how to account for the license fees. In SaaS arrangements where
software licenses are not sold, the entire arrangement is recognized ratably over the term of the
subscription arrangement.
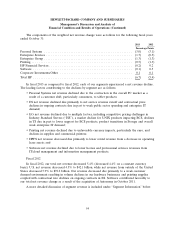
Warranty Provision
We accrue the estimated cost of product warranties at the time we recognize revenue. We evaluate
our warranty obligations on a product group basis. Our standard product warranty terms generally
include post-sales support and repairs or replacement of a product at no additional charge for a
specified period of time. While we engage in extensive product quality programs and processes,
including actively monitoring and evaluating the quality of our component suppliers, we base our
estimated warranty obligation on contractual warranty terms, repair costs, product call rates, average
cost per call, current period product shipments and ongoing product failure rates, as well as specific
product class failure outside of our baseline experience. Warranty terms generally range from 90 days
to three years for parts and labor, depending upon the product. Over the last three fiscal years, the
annual warranty provision and actual warranty costs have averaged approximately 2.9% and 3.1% of
annual net product revenue, respectively.
Business Combinations
We allocate the fair value of purchase consideration to the assets acquired, liabilities assumed, and
non-controlling interests in the acquiree generally based on their fair values at the acquisition date. The
excess of the fair value of purchase consideration over the fair value of these assets acquired, liabilities
assumed and non-controlling interests in the acquiree is recorded as goodwill.
When determining the fair values of assets acquired, liabilities assumed, and non-controlling
interests in the acquiree, management makes significant estimates and assumptions, especially with
respect to intangible assets. Critical estimates in valuing intangible assets include, but are not limited
to, expected future cash flows, which includes consideration of future growth rates and margins,
attrition rates, future changes in technology and brand awareness, loyalty and position, and discount
rates. Fair value estimates are based on the assumptions management believes a market participant
would use in pricing the asset or liability. Amounts recorded in a business combination may change
during the measurement period, which is a period not to exceed one year from the date of acquisition,
as additional information about conditions existing at the acquisition date becomes available.
46