HP 2013 Annual Report Download - page 107
Download and view the complete annual report
Please find page 107 of the 2013 HP annual report below. You can navigate through the pages in the report by either clicking on the pages listed below, or by using the keyword search tool below to find specific information within the annual report.-
 1
1 -
2
-
3
-
4
-
5
-
6
-
7
-
8
-
9
-
10
-
11
-
12
-
13
-
14
-
15
-
16
-
17
-
18
-
19
-
20
-
21
-
22
-
23
-
24
-
25
-
26
-
27
-
28
-
29
-
30
-
31
-
32
-
33
-
34
-
35
-
36
-
37
-
38
-
39
-
40
-
41
-
42
-
43
-
44
-
45
-
46
-
47
-
48
-
49
-
50
-
51
-
52
-
53
-
54
-
55
-
56
-
57
-
58
-
59
-
60
-
61
-
62
-
63
-
64
-
65
-
66
-
67
-
68
-
69
-
70
-
71
-
72
-
73
-
74
-
75
-
76
-
77
-
78
-
79
-
80
-
81
-
82
-
83
-
84
-
85
-
86
-
87
-
88
-
89
-
90
-
91
-
92
-
93
-
94
-
95
-
96
-
 97
97 -
 98
98 -
 99
99 -
 100
100 -
 101
101 -
 102
102 -
 103
103 -
 104
104 -
 105
105 -
 106
106 -
 107
107 -
 108
108 -
 109
109 -
 110
110 -
 111
111 -
 112
112 -
 113
113 -
 114
114 -
 115
115 -
 116
116 -
 117
117 -
118
-
119
-
120
-
121
-
122
-
123
-
124
-
125
-
126
-
127
-
128
-
129
-
130
-
131
-
132
-
133
-
134
-
135
-
136
-
137
-
138
-
139
-
140
-
141
-
142
-
143
-
144
-
145
-
146
-
147
-
148
-
149
-
150
-
151
-
152
-
153
-
154
-
155
-
156
-
157
-
158
-
159
-
160
-
161
-
162
-
163
-
164
-
165
-
166
-
167
-
168
-
169
-
170
-
171
-
172
-
173
-
174
-
175
-
176
-
177
-
178
-
179
-
180
-
181
-
182
-
183
-
184
-
185
-
186
-
187
-
188
-
189
-
190
-
191
-
192
-
193
-
194
-
195
-
196
-
197
-
198
-
199
-
200
-
201
-
202
-
203
-
204
 |
 |

HEWLETT-PACKARD COMPANY AND SUBSIDIARIES
Notes to Consolidated Financial Statements (Continued)
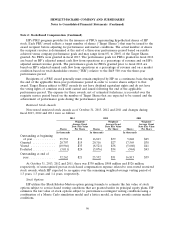
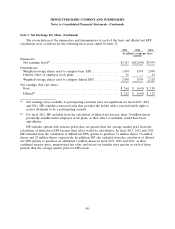
Note 2: Stock-Based Compensation (Continued)
average assumptions, in addition to projections of market conditions, used to measure the weighted-
average fair values were as follows for fiscal years ended October 31:
2013 2012 2011
Weighted-average fair value of grants per unit ...................... $0.00(1) $3.35(2) $27.59(3)
Expected volatility(4) ......................................... 33% 41% 30%
Risk-free interest rate ........................................ 0.18% 0.14% 0.38%
Expected dividend yield ...................................... 3.94% 1.78% 0.75%
Expected term in months ..................................... 12 15 19
(1) Reflects the weighted-average fair value for the third year of the three-year performance period
applicable to PRUs granted in fiscal 2011. The weighted-average fair value per unit is zero based
on the result of the Monte-Carlo simulation model using the weighted-average assumptions on the
measurement date.
(2) Reflects the weighted-average fair value for the third year of the three-year performance period
applicable to PRUs granted in fiscal 2010 and for the second year of the three-year performance
period applicable to PRUs granted in fiscal 2011.
(3) Reflects the weighted-average fair value for the third year of the three-year performance period
applicable to PRUs granted in fiscal 2009, for the second year of the three-year performance
period applicable to PRUs granted in fiscal 2010 and for the first year of the three-year
performance period applicable to PRUs granted in fiscal 2011.
(4) HP uses historic volatility for PRU awards when simulating multivariate prices for companies in
the S&P 500.
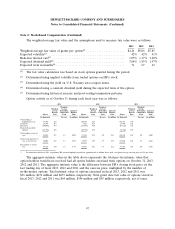
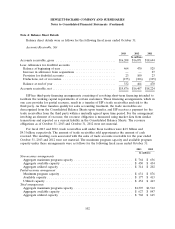
Non-vested PRUs as of October 31, 2013, 2012 and 2011 and changes during fiscal 2013, 2012 and
2011 were as follows:
2013 2012 2011
Shares in thousands
Outstanding Target Shares at beginning of year ................... 5,688 11,382 18,508
Granted ................................................ — 1,251 5,950
Change in units due to performance and market conditions achievement
for PRUs vested in the year(1) .............................. (4,307) (5,617) (10,862)
Forfeited ............................................... (356) (1,328) (2,214)
Outstanding Target Shares at end of year ........................ 1,025 5,688 11,382
Outstanding Target Shares of PRUs assigned a fair value at end of year . 690(2) 3,492(3) 5,867(4)
(1) The minimum level of TSR was not met for PRUs granted in fiscal 2011, 2010 and 2009, which
resulted in the cancellation of Target Shares.
(2) Excludes Target Shares for the third year for PRUs granted in fiscal 2012 as the measurement date
had not yet been established. The measurement date and related fair value for the excluded PRUs
will be established when the annual performance goals are approved.
(3) Excludes Target Shares for the third year for PRUs granted in fiscal 2011 and for the second and
third years for PRUs granted in fiscal 2012 as the measurement dates had not yet been
established.
99