HP 2013 Annual Report Download - page 66
Download and view the complete annual report
Please find page 66 of the 2013 HP annual report below. You can navigate through the pages in the report by either clicking on the pages listed below, or by using the keyword search tool below to find specific information within the annual report.-
 1
1 -
2
-
3
-
4
-
5
-
6
-
7
-
8
-
9
-
10
-
11
-
12
-
13
-
14
-
15
-
16
-
17
-
18
-
19
-
20
-
21
-
22
-
23
-
24
-
25
-
26
-
27
-
28
-
29
-
30
-
31
-
32
-
33
-
34
-
35
-
36
-
37
-
38
-
39
-
40
-
41
-
42
-
43
-
44
-
45
-
46
-
47
-
48
-
49
-
50
-
51
-
52
-
53
-
54
-
55
-
 56
56 -
 57
57 -
 58
58 -
 59
59 -
 60
60 -
 61
61 -
 62
62 -
 63
63 -
 64
64 -
 65
65 -
 66
66 -
 67
67 -
 68
68 -
 69
69 -
 70
70 -
 71
71 -
 72
72 -
 73
73 -
 74
74 -
 75
75 -
 76
76 -
77
-
78
-
79
-
80
-
81
-
82
-
83
-
84
-
85
-
86
-
87
-
88
-
89
-
90
-
91
-
92
-
93
-
94
-
95
-
96
-
97
-
98
-
99
-
100
-
101
-
102
-
103
-
104
-
105
-
106
-
107
-
108
-
109
-
110
-
111
-
112
-
113
-
114
-
115
-
116
-
117
-
118
-
119
-
120
-
121
-
122
-
123
-
124
-
125
-
126
-
127
-
128
-
129
-
130
-
131
-
132
-
133
-
134
-
135
-
136
-
137
-
138
-
139
-
140
-
141
-
142
-
143
-
144
-
145
-
146
-
147
-
148
-
149
-
150
-
151
-
152
-
153
-
154
-
155
-
156
-
157
-
158
-
159
-
160
-
161
-
162
-
163
-
164
-
165
-
166
-
167
-
168
-
169
-
170
-
171
-
172
-
173
-
174
-
175
-
176
-
177
-
178
-
179
-
180
-
181
-
182
-
183
-
184
-
185
-
186
-
187
-
188
-
189
-
190
-
191
-
192
-
193
-
194
-
195
-
196
-
197
-
198
-
199
-
200
-
201
-
202
-
203
-
204
 |
 |

HEWLETT-PACKARD COMPANY AND SUBSIDIARIES
Management’s Discussion and Analysis of
Financial Condition and Results of Operations (Continued)
In addition to the above factors, the overall tax rates in fiscal 2012 and 2011 were impacted by
nondeductible goodwill impairments and increases in valuation allowances against certain deferred tax
assets.
For a full reconciliation of our effective tax rate to the U.S. federal statutory rate of 35% and
further explanation of our provision for taxes, see Note 13 to the Consolidated Financial Statements in
Item 8, which is incorporated herein by reference.
Segment Information
A description of the products and services for each segment can be found in Note 18 to the
Consolidated Financial Statements in Item 8, which is incorporated herein by reference. Future changes
to this organizational structure may result in changes to the business segments disclosed.
We have implemented certain organizational realignments. As a result of these realignments, we
re-evaluated our segment financial reporting structure and, effective in the first quarter of fiscal 2013:
• We created a new EG segment consisting of our TS business unit, which was previously a part of
our former ESSN segment;
• We created a new ES segment consisting of our Infrastructure Technology Outsourcing (‘‘ITO’’)
business unit, and our Application and Business Services (‘‘ABS’’) business unit both of which
were previously a part of our former Services segment;
• We transferred our Personal Systems commercial products support business from our TS
business unit to the Other business unit within our Personal Systems segment;
• We transferred our end-user workplace support business from our TS business unit to our ITO
business unit within our new ES segment; and
• We transferred the portion of our business intelligence services business that was a part of our
Corporate Investments segment to our ABS business unit within our new ES segment.
As noted above, as a result of these changes, we created two new reportable segments, the EG segment
and the ES segment. Also as noted above, we eliminated two existing reportable segments, the ESSN
segment and the Services segment. Taking into account these changes, effective at the beginning of our
first quarter of fiscal 2013, our seven reportable segments are Personal Systems, Printing, the Enterprise
Group, Enterprise Services, Software, HP Financial Services and Corporate Investments.
Printing and Personal Systems Group
Printing and Personal Systems segments were realigned beneath a newly formed Printing and
Personal Systems Group during fiscal 2012. We describe the results of the business segments within the
Printing and Personal Systems Group in more detail below.
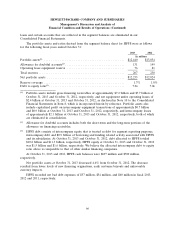
Personal Systems
For the fiscal years ended October 31
2013 2012 2011
In millions
Net revenue ........................................... $32,071 $35,725 $39,654
Earnings from operations ................................. $ 949 $ 1,689 $ 2,327
Earnings from operations as a % of net revenue ................ 3.0% 4.7% 5.9%
58