HP 2013 Annual Report Download - page 46
Download and view the complete annual report
Please find page 46 of the 2013 HP annual report below. You can navigate through the pages in the report by either clicking on the pages listed below, or by using the keyword search tool below to find specific information within the annual report.-
 1
1 -
2
-
3
-
4
-
5
-
6
-
7
-
8
-
9
-
10
-
11
-
12
-
13
-
14
-
15
-
16
-
17
-
18
-
19
-
20
-
21
-
22
-
23
-
24
-
25
-
26
-
27
-
28
-
29
-
30
-
31
-
32
-
33
-
34
-
35
-
 36
36 -
 37
37 -
 38
38 -
 39
39 -
 40
40 -
 41
41 -
 42
42 -
 43
43 -
 44
44 -
 45
45 -
 46
46 -
 47
47 -
 48
48 -
 49
49 -
 50
50 -
 51
51 -
 52
52 -
 53
53 -
 54
54 -
 55
55 -
 56
56 -
57
-
58
-
59
-
60
-
61
-
62
-
63
-
64
-
65
-
66
-
67
-
68
-
69
-
70
-
71
-
72
-
73
-
74
-
75
-
76
-
77
-
78
-
79
-
80
-
81
-
82
-
83
-
84
-
85
-
86
-
87
-
88
-
89
-
90
-
91
-
92
-
93
-
94
-
95
-
96
-
97
-
98
-
99
-
100
-
101
-
102
-
103
-
104
-
105
-
106
-
107
-
108
-
109
-
110
-
111
-
112
-
113
-
114
-
115
-
116
-
117
-
118
-
119
-
120
-
121
-
122
-
123
-
124
-
125
-
126
-
127
-
128
-
129
-
130
-
131
-
132
-
133
-
134
-
135
-
136
-
137
-
138
-
139
-
140
-
141
-
142
-
143
-
144
-
145
-
146
-
147
-
148
-
149
-
150
-
151
-
152
-
153
-
154
-
155
-
156
-
157
-
158
-
159
-
160
-
161
-
162
-
163
-
164
-
165
-
166
-
167
-
168
-
169
-
170
-
171
-
172
-
173
-
174
-
175
-
176
-
177
-
178
-
179
-
180
-
181
-
182
-
183
-
184
-
185
-
186
-
187
-
188
-
189
-
190
-
191
-
192
-
193
-
194
-
195
-
196
-
197
-
198
-
199
-
200
-
201
-
202
-
203
-
204
 |
 |

27NOV201315294001
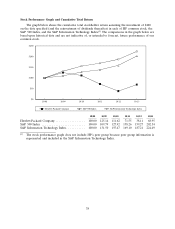
Stock Performance Graph and Cumulative Total Return
The graph below shows the cumulative total stockholder return assuming the investment of $100
on the date specified (and the reinvestment of dividends thereafter) in each of HP common stock, the
S&P 500 Index, and the S&P Information Technology Index.(1) The comparisons in the graph below are
based upon historical data and are not indicative of, or intended to forecast, future performance of our
common stock.
$0
$50
$100
$150
$200
$250
10/08 10/09 10/10 10/11 10/12 10/13
S&P 500 Index S&P Information Technology IndexHewlett-Packard Company
10/08 10/09 10/10 10/11 10/12 10/13
Hewlett-Packard Company ................. 100.00 125.14 111.62 71.55 38.11 68.95
S&P 500 Index ......................... 100.00 109.79 127.92 138.26 159.27 202.54
S&P Information Technology Index ........... 100.00 131.50 155.47 169.10 187.21 224.49
(1) The stock performance graph does not include HP’s peer group because peer group information is
represented and included in the S&P Information Technology Index.
38