HP 2013 Annual Report Download - page 47
Download and view the complete annual report
Please find page 47 of the 2013 HP annual report below. You can navigate through the pages in the report by either clicking on the pages listed below, or by using the keyword search tool below to find specific information within the annual report.-
 1
1 -
2
-
3
-
4
-
5
-
6
-
7
-
8
-
9
-
10
-
11
-
12
-
13
-
14
-
15
-
16
-
17
-
18
-
19
-
20
-
21
-
22
-
23
-
24
-
25
-
26
-
27
-
28
-
29
-
30
-
31
-
32
-
33
-
34
-
35
-
36
-
 37
37 -
 38
38 -
 39
39 -
 40
40 -
 41
41 -
 42
42 -
 43
43 -
 44
44 -
 45
45 -
 46
46 -
 47
47 -
 48
48 -
 49
49 -
 50
50 -
 51
51 -
 52
52 -
 53
53 -
 54
54 -
 55
55 -
 56
56 -
 57
57 -
58
-
59
-
60
-
61
-
62
-
63
-
64
-
65
-
66
-
67
-
68
-
69
-
70
-
71
-
72
-
73
-
74
-
75
-
76
-
77
-
78
-
79
-
80
-
81
-
82
-
83
-
84
-
85
-
86
-
87
-
88
-
89
-
90
-
91
-
92
-
93
-
94
-
95
-
96
-
97
-
98
-
99
-
100
-
101
-
102
-
103
-
104
-
105
-
106
-
107
-
108
-
109
-
110
-
111
-
112
-
113
-
114
-
115
-
116
-
117
-
118
-
119
-
120
-
121
-
122
-
123
-
124
-
125
-
126
-
127
-
128
-
129
-
130
-
131
-
132
-
133
-
134
-
135
-
136
-
137
-
138
-
139
-
140
-
141
-
142
-
143
-
144
-
145
-
146
-
147
-
148
-
149
-
150
-
151
-
152
-
153
-
154
-
155
-
156
-
157
-
158
-
159
-
160
-
161
-
162
-
163
-
164
-
165
-
166
-
167
-
168
-
169
-
170
-
171
-
172
-
173
-
174
-
175
-
176
-
177
-
178
-
179
-
180
-
181
-
182
-
183
-
184
-
185
-
186
-
187
-
188
-
189
-
190
-
191
-
192
-
193
-
194
-
195
-
196
-
197
-
198
-
199
-
200
-
201
-
202
-
203
-
204
 |
 |

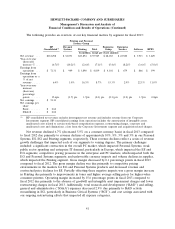
ITEM 6. Selected Financial Data.
The information set forth below is not necessarily indicative of results of future operations and
should be read in conjunction with Item 7, ‘‘Management’s Discussion and Analysis of Financial
Condition and Results of Operations,’’ and the Consolidated Financial Statements and notes thereto
included in Item 8, ‘‘Financial Statements and Supplementary Data,’’ of this Annual Report on
Form 10-K, which are incorporated herein by reference, in order to understand further the factors that
may affect the comparability of the financial data presented below.
HEWLETT-PACKARD COMPANY AND SUBSIDIARIES
Selected Financial Data
For the fiscal years ended October 31
2013 2012 2011 2010 2009
In millions, except per share amounts
Net revenue .......................... $112,298 $120,357 $127,245 $126,033 $114,552
Earnings (loss) from operations(1) .......... $ 7,131 $(11,057) $ 9,677 $ 11,479 $ 10,136
Net earnings (loss)(1) ................... $ 5,113 $(12,650) $ 7,074 $ 8,761 $ 7,660
Net earnings (loss) per share
Basic ............................. $ 2.64 $ (6.41) $ 3.38 $ 3.78 $ 3.21
Diluted ........................... $ 2.62 $ (6.41) $ 3.32 $ 3.69 $ 3.14
Cash dividends declared per share .......... $ 0.55 $ 0.50 $ 0.40 $ 0.32 $ 0.32
At year-end:
Total assets(2) ....................... $105,676 $108,768 $129,517 $124,503 $114,799
Long-term debt ..................... $ 16,608 $ 21,789 $ 22,551 $ 15,258 $ 13,980
Total debt(3) ........................ $ 22,587 $ 28,436 $ 30,634 $ 22,304 $ 15,830
(1) Earnings (Loss) from operations and net earnings (loss) include the following items:
2013 2012 2011 2010 2009
In millions
Amortization of intangible assets ............... $1,373 $ 1,784 $1,607 $1,484 $1,578
Impairment of goodwill and intangible assets ...... — 18,035 885 — —
Wind down of webOS device business ........... — (36) 755 — —
Wind down of non-strategic businesses ........... — 108 — — —
Restructuring charges ....................... 990 2,266 645 1,144 640
Acquisition-related charges ................... 22 45 182 293 242
Total charges before taxes .................... $2,385 $22,202 $4,074 $2,921 $2,460
Total charges, net of taxes .................... $1,825 $20,685 $3,130 $2,105 $1,733
(2) Total assets decreased in fiscal 2012 due primarily to goodwill and intangible asset impairment
charges associated with the Autonomy reporting unit within the Software segment, a goodwill
impairment charge associated with the Enterprise Services segment and an intangible asset
impairment charge associated with the ‘‘Compaq’’ trade name within the Personal Systems
segment. Total assets increased in fiscal 2011 and 2010 due primarily to acquisitions in the
respective fiscal years.
(3) In fiscal 2013, total debt decreased due to maturities. Total debt increased in fiscal 2011 and 2010
due primarily to acquisitions and share repurchases.
39