HP 2013 Annual Report Download - page 72
Download and view the complete annual report
Please find page 72 of the 2013 HP annual report below. You can navigate through the pages in the report by either clicking on the pages listed below, or by using the keyword search tool below to find specific information within the annual report.-
 1
1 -
2
-
3
-
4
-
5
-
6
-
7
-
8
-
9
-
10
-
11
-
12
-
13
-
14
-
15
-
16
-
17
-
18
-
19
-
20
-
21
-
22
-
23
-
24
-
25
-
26
-
27
-
28
-
29
-
30
-
31
-
32
-
33
-
34
-
35
-
36
-
37
-
38
-
39
-
40
-
41
-
42
-
43
-
44
-
45
-
46
-
47
-
48
-
49
-
50
-
51
-
52
-
53
-
54
-
55
-
56
-
57
-
58
-
59
-
60
-
61
-
 62
62 -
 63
63 -
 64
64 -
 65
65 -
 66
66 -
 67
67 -
 68
68 -
 69
69 -
 70
70 -
 71
71 -
 72
72 -
 73
73 -
 74
74 -
 75
75 -
 76
76 -
 77
77 -
 78
78 -
 79
79 -
 80
80 -
 81
81 -
 82
82 -
83
-
84
-
85
-
86
-
87
-
88
-
89
-
90
-
91
-
92
-
93
-
94
-
95
-
96
-
97
-
98
-
99
-
100
-
101
-
102
-
103
-
104
-
105
-
106
-
107
-
108
-
109
-
110
-
111
-
112
-
113
-
114
-
115
-
116
-
117
-
118
-
119
-
120
-
121
-
122
-
123
-
124
-
125
-
126
-
127
-
128
-
129
-
130
-
131
-
132
-
133
-
134
-
135
-
136
-
137
-
138
-
139
-
140
-
141
-
142
-
143
-
144
-
145
-
146
-
147
-
148
-
149
-
150
-
151
-
152
-
153
-
154
-
155
-
156
-
157
-
158
-
159
-
160
-
161
-
162
-
163
-
164
-
165
-
166
-
167
-
168
-
169
-
170
-
171
-
172
-
173
-
174
-
175
-
176
-
177
-
178
-
179
-
180
-
181
-
182
-
183
-
184
-
185
-
186
-
187
-
188
-
189
-
190
-
191
-
192
-
193
-
194
-
195
-
196
-
197
-
198
-
199
-
200
-
201
-
202
-
203
-
204
 |
 |

HEWLETT-PACKARD COMPANY AND SUBSIDIARIES
Management’s Discussion and Analysis of
Financial Condition and Results of Operations (Continued)
declines in short-term project work combined with an unfavorable currency impact, the effect of which
was partially offset by increases in sales of cloud and information management and analytics offerings.
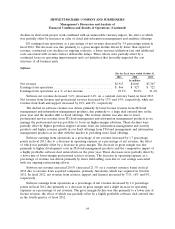
ES earnings from operations as a percentage of net revenue decreased by 3.4 percentage points in
fiscal 2012. The decrease was due primarily to a gross margin decline driven by lower than expected
revenue, contractual rate declines on ongoing contracts, a lower resource utilization rate and additional
costs associated with certain contract deliverable delays. These effects were partially offset by a
continued focus on operating improvements and cost initiatives that favorably impacted the cost
structure of all business units.
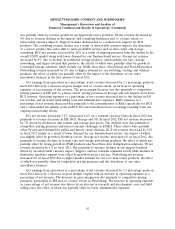
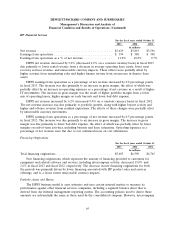
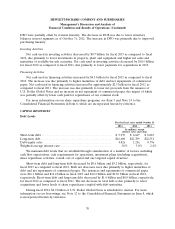
Software
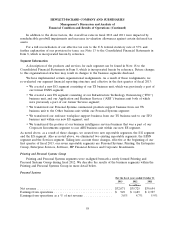
For the fiscal years ended October 31
2013 2012 2011
In millions
Net revenue .......................................... $3,913 $4,060 $3,367
Earnings from operations ................................. $ 866 $ 827 $ 722
Earnings from operations as a % of net revenue ................ 22.1% 20.4% 21.4%
Software net revenue decreased 3.6% (decreased 2.6% on a constant currency basis) in fiscal 2013.
Net revenue from licenses and professional services decreased by 17% and 14%, respectively, while net
revenue from SaaS and support increased by 10% and 8%, respectively.
The decline in software revenue was driven primarily by lower license revenue from IT/cloud
management and information management products, due primarily to a large deal entered into in the
prior year and the market shift to SaaS offerings. The revenue decline was also due to lower
professional services revenue from IT/cloud management and information management products as we
manage the professional services portfolio to focus on higher-margin solutions. These declines were
partially offset by higher growth in support revenue from our information management and security
products and higher revenue growth in our SaaS offerings from IT/cloud management and information
management products as we shift with the market to providing more SaaS offerings.
Software earnings from operations as a percentage of net revenue increased by 1.7 percentage
points in fiscal 2013 due to a decrease in operating expense as a percentage of net revenue, the effect
of which was partially offset by a decrease in gross margin. The decrease in gross margin was due
primarily to higher development costs in IT/cloud management products and the comparative impact of
a highly profitable software deal entered into in the prior year. These decreases were partially offset by
a lower mix of lower-margin professional services revenue. The decrease in operating expense as a
percentage of revenue was driven primarily by lower field selling costs due to cost savings associated
with our ongoing restructuring efforts.
Software net revenue increased 20.6% (increased 21.3% on a constant currency basis) in fiscal
2012 due to revenue from acquired companies, primarily Autonomy, which was acquired in October
2011. In fiscal 2012, net revenue from services, support and licenses increased by 71%, 16% and 8%,
respectively.
Software earnings from operations as a percentage of net revenue decreased by 1.0 percentage
points in fiscal 2012 due primarily to a decrease in gross margin and a slight increase in operating
expenses as a percentage of net revenue. The gross margin decline was due primarily to a lower mix of
license revenue, the effect of which was partially offset by a highly profitable software deal entered into
in the fourth quarter of fiscal 2012.
64