HP 2013 Annual Report Download - page 59
Download and view the complete annual report
Please find page 59 of the 2013 HP annual report below. You can navigate through the pages in the report by either clicking on the pages listed below, or by using the keyword search tool below to find specific information within the annual report.-
 1
1 -
2
-
3
-
4
-
5
-
6
-
7
-
8
-
9
-
10
-
11
-
12
-
13
-
14
-
15
-
16
-
17
-
18
-
19
-
20
-
21
-
22
-
23
-
24
-
25
-
26
-
27
-
28
-
29
-
30
-
31
-
32
-
33
-
34
-
35
-
36
-
37
-
38
-
39
-
40
-
41
-
42
-
43
-
44
-
45
-
46
-
47
-
48
-
 49
49 -
 50
50 -
 51
51 -
 52
52 -
 53
53 -
 54
54 -
 55
55 -
 56
56 -
 57
57 -
 58
58 -
 59
59 -
 60
60 -
 61
61 -
 62
62 -
 63
63 -
 64
64 -
 65
65 -
 66
66 -
 67
67 -
 68
68 -
 69
69 -
70
-
71
-
72
-
73
-
74
-
75
-
76
-
77
-
78
-
79
-
80
-
81
-
82
-
83
-
84
-
85
-
86
-
87
-
88
-
89
-
90
-
91
-
92
-
93
-
94
-
95
-
96
-
97
-
98
-
99
-
100
-
101
-
102
-
103
-
104
-
105
-
106
-
107
-
108
-
109
-
110
-
111
-
112
-
113
-
114
-
115
-
116
-
117
-
118
-
119
-
120
-
121
-
122
-
123
-
124
-
125
-
126
-
127
-
128
-
129
-
130
-
131
-
132
-
133
-
134
-
135
-
136
-
137
-
138
-
139
-
140
-
141
-
142
-
143
-
144
-
145
-
146
-
147
-
148
-
149
-
150
-
151
-
152
-
153
-
154
-
155
-
156
-
157
-
158
-
159
-
160
-
161
-
162
-
163
-
164
-
165
-
166
-
167
-
168
-
169
-
170
-
171
-
172
-
173
-
174
-
175
-
176
-
177
-
178
-
179
-
180
-
181
-
182
-
183
-
184
-
185
-
186
-
187
-
188
-
189
-
190
-
191
-
192
-
193
-
194
-
195
-
196
-
197
-
198
-
199
-
200
-
201
-
202
-
203
-
204
 |
 |
HEWLETT-PACKARD COMPANY AND SUBSIDIARIES
Management’s Discussion and Analysis of
Financial Condition and Results of Operations (Continued)
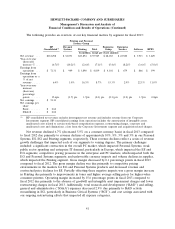
Inventory
We state our inventory at the lower of cost or market. We make adjustments to reduce the cost of
inventory to its net realizable value, if required, at the product group level for estimated excess,
obsolescence or impaired balances. Factors influencing these adjustments include changes in demand,
technological changes, product life cycle and development plans, component cost trends, product
pricing, physical deterioration and quality issues.
Fair Value of Derivative Instruments
We use derivative instruments to manage a variety of risks, including risks related to interest rates
and foreign exchange. HP mainly holds non-speculative forwards, swaps and options to hedge certain
foreign currency and interest rate exposures. At October 31, 2013, the gross notional of our derivative
portfolio was $51.9 billion. Assets and liabilities related to derivative instruments are measured at fair
value every reporting period. At October 31, 2013, derivative assets and liabilities were $452 million
and $656 million, respectively.
Fair value is the price we would receive to sell an asset or pay to transfer a liability in an orderly
transaction between market participants at the measurement date. In the absence of active markets for
the identical assets or liabilities, such measurements involve developing assumptions based on market
observable data and, in the absence of such data, internal information that is consistent with what
market participants would use in a hypothetical transaction that occurs at the measurement date. The
determination of fair value often involves significant judgments about assumptions such as determining
an appropriate discount rate that factors in both risk and liquidity premiums, identifying the similarities
and differences in market transactions, weighting those differences accordingly and then making the
appropriate adjustments to those market transactions to reflect the risks specific to our asset or liability
being valued. HP generally uses industry standard valuation models to measure the fair value of its
derivative positions. When prices in active markets are not available for the identical asset or liability,
HP uses industry standard valuation models to measure fair value. Where applicable, these models
project future cash flows and discount the future amounts to present value using market based
observable inputs, including interest rate curves, HP and counterparty credit risk, foreign exchange
rates, and forward and spot prices.
For a further discussion on fair value measurements and derivative instruments, refer to Note 8
and Note 9, respectively, to the Consolidated Financial Statements in Item 8, which are incorporated
herein by reference.
Retirement and Post-Retirement Benefits
Our pension and other post-retirement benefit costs and obligations are dependent on various
assumptions. Our major assumptions relate primarily to discount rates, future compensation growth
rates and the expected long-term return on plan assets. The discount rate assumption is based on
current investment yields of high-quality fixed-income securities with maturities similar to the expected
benefits payment period. The future compensation growth rate assumption reflects our long-term actual
experience and future outlook. The expected long-term return on plan assets is determined based on
asset allocations, historical portfolio results, historical asset correlations, and management’s expected
returns for each asset class. In any fiscal year, significant differences may arise between the actual
return and the expected long-term return on plan assets. Historically, differences between the actual
return and expected long-term return on plan assets have resulted from changes in target or actual
asset allocation, short-term asset performance relative to expected long-term asset performance,
51