HP 2013 Annual Report Download - page 171
Download and view the complete annual report
Please find page 171 of the 2013 HP annual report below. You can navigate through the pages in the report by either clicking on the pages listed below, or by using the keyword search tool below to find specific information within the annual report.-
 1
1 -
2
-
3
-
4
-
5
-
6
-
7
-
8
-
9
-
10
-
11
-
12
-
13
-
14
-
15
-
16
-
17
-
18
-
19
-
20
-
21
-
22
-
23
-
24
-
25
-
26
-
27
-
28
-
29
-
30
-
31
-
32
-
33
-
34
-
35
-
36
-
37
-
38
-
39
-
40
-
41
-
42
-
43
-
44
-
45
-
46
-
47
-
48
-
49
-
50
-
51
-
52
-
53
-
54
-
55
-
56
-
57
-
58
-
59
-
60
-
61
-
62
-
63
-
64
-
65
-
66
-
67
-
68
-
69
-
70
-
71
-
72
-
73
-
74
-
75
-
76
-
77
-
78
-
79
-
80
-
81
-
82
-
83
-
84
-
85
-
86
-
87
-
88
-
89
-
90
-
91
-
92
-
93
-
94
-
95
-
96
-
97
-
98
-
99
-
100
-
101
-
102
-
103
-
104
-
105
-
106
-
107
-
108
-
109
-
110
-
111
-
112
-
113
-
114
-
115
-
116
-
117
-
118
-
119
-
120
-
121
-
122
-
123
-
124
-
125
-
126
-
127
-
128
-
129
-
130
-
131
-
132
-
133
-
134
-
135
-
136
-
137
-
138
-
139
-
140
-
141
-
142
-
143
-
144
-
145
-
146
-
147
-
148
-
149
-
150
-
151
-
152
-
153
-
154
-
155
-
156
-
157
-
158
-
159
-
160
-
 161
161 -
 162
162 -
 163
163 -
 164
164 -
 165
165 -
 166
166 -
 167
167 -
 168
168 -
 169
169 -
 170
170 -
 171
171 -
 172
172 -
 173
173 -
 174
174 -
 175
175 -
 176
176 -
 177
177 -
 178
178 -
 179
179 -
 180
180 -
 181
181 -
182
-
183
-
184
-
185
-
186
-
187
-
188
-
189
-
190
-
191
-
192
-
193
-
194
-
195
-
196
-
197
-
198
-
199
-
200
-
201
-
202
-
203
-
204
 |
 |

HEWLETT-PACKARD COMPANY AND SUBSIDIARIES
Notes to Consolidated Financial Statements (Continued)
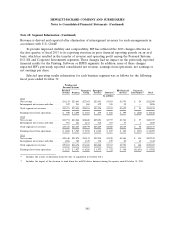
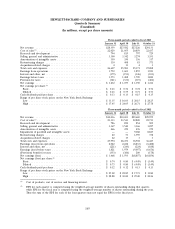
Note 18: Segment Information (Continued)
Major Customers
No single customer represented 10% or more of HP’s total net revenue in any fiscal year
presented.
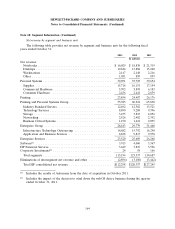
Geographic Information
Net revenue, classified by the major geographic areas in which HP operates, was as follows for the
following fiscal years ended October 31:
2013 2012 2011
In millions
Net revenue:
U.S................................................. $ 40,284 $ 42,140 $ 44,111
Non-U.S. ............................................ 72,014 78,217 83,134
Total HP consolidated net revenue .......................... $112,298 $120,357 $127,245
Net revenue by geographic area is based upon the sales location that predominately represents the
customer location. For each of the fiscal years ended October 31, 2013, 2012 and 2011, other than the
United States, no country represented more than 10% of HP’s total consolidated net revenue. HP
reports revenue net of sales taxes, use taxes and value-added taxes directly imposed by governmental
authorities on HP’s revenue producing transactions with its customers.
At October 31, 2013 and 2012, the United States, the Cayman Islands and Ireland each had 10%
or more of HP’s consolidated net assets. At October 31, 2011, the United States and the Netherlands
each had 10% or more of HP’s consolidated net assets.
Net property, plant and equipment, classified by major geographic areas in which HP operates, was
as follows for the following fiscal years ended October 31:
2013 2012 2011
In millions
Net property, plant and equipment:
U.S. .................................................. $ 5,546 $ 5,894 $ 6,126
U.K. .................................................. 1,090 1,195 1,195
Other countries .......................................... 4,827 4,865 4,971
Total HP consolidated net property, plant and equipment ............ $11,463 $11,954 $12,292
163