HP 2013 Annual Report Download - page 64
Download and view the complete annual report
Please find page 64 of the 2013 HP annual report below. You can navigate through the pages in the report by either clicking on the pages listed below, or by using the keyword search tool below to find specific information within the annual report.-
 1
1 -
2
-
3
-
4
-
5
-
6
-
7
-
8
-
9
-
10
-
11
-
12
-
13
-
14
-
15
-
16
-
17
-
18
-
19
-
20
-
21
-
22
-
23
-
24
-
25
-
26
-
27
-
28
-
29
-
30
-
31
-
32
-
33
-
34
-
35
-
36
-
37
-
38
-
39
-
40
-
41
-
42
-
43
-
44
-
45
-
46
-
47
-
48
-
49
-
50
-
51
-
52
-
53
-
 54
54 -
 55
55 -
 56
56 -
 57
57 -
 58
58 -
 59
59 -
 60
60 -
 61
61 -
 62
62 -
 63
63 -
 64
64 -
 65
65 -
 66
66 -
 67
67 -
 68
68 -
 69
69 -
 70
70 -
 71
71 -
 72
72 -
 73
73 -
 74
74 -
75
-
76
-
77
-
78
-
79
-
80
-
81
-
82
-
83
-
84
-
85
-
86
-
87
-
88
-
89
-
90
-
91
-
92
-
93
-
94
-
95
-
96
-
97
-
98
-
99
-
100
-
101
-
102
-
103
-
104
-
105
-
106
-
107
-
108
-
109
-
110
-
111
-
112
-
113
-
114
-
115
-
116
-
117
-
118
-
119
-
120
-
121
-
122
-
123
-
124
-
125
-
126
-
127
-
128
-
129
-
130
-
131
-
132
-
133
-
134
-
135
-
136
-
137
-
138
-
139
-
140
-
141
-
142
-
143
-
144
-
145
-
146
-
147
-
148
-
149
-
150
-
151
-
152
-
153
-
154
-
155
-
156
-
157
-
158
-
159
-
160
-
161
-
162
-
163
-
164
-
165
-
166
-
167
-
168
-
169
-
170
-
171
-
172
-
173
-
174
-
175
-
176
-
177
-
178
-
179
-
180
-
181
-
182
-
183
-
184
-
185
-
186
-
187
-
188
-
189
-
190
-
191
-
192
-
193
-
194
-
195
-
196
-
197
-
198
-
199
-
200
-
201
-
202
-
203
-
204
 |
 |
HEWLETT-PACKARD COMPANY AND SUBSIDIARIES
Management’s Discussion and Analysis of
Financial Condition and Results of Operations (Continued)
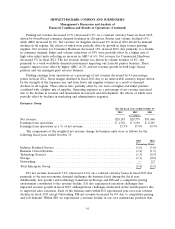
A more detailed discussion of segment operating margins is included under ‘‘Segment
Information’’ below.
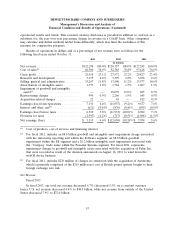
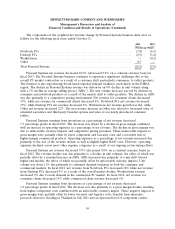
Operating Expenses
Research and Development
R&D expense decreased in fiscal 2013 due primarily to the rationalization of R&D in EG for
BCS, cost savings from restructuring and higher value added R&D tax subsidy credits. The decrease
was partially offset by increased R&D expense in our Storage and ISS business units and in Software
for innovation-focused spending in the areas of converged infrastructure and converged cloud. In fiscal
2013, R&D expense as a percentage of revenue increased for Software, Personal Systems and ES,
decreased for EG, and was flat for Printing.
R&D expense increased in fiscal 2012 due primarily to additional expense from the acquisition of
Autonomy and innovation-focused spending for Storage, Networking and converged cloud. The increase
was partially offset by the elimination of R&D expense associated with the former webOS device
business. In fiscal 2012, R&D expense as a percentage of revenue increased for EG, Software, Printing
and Personal Systems, and was flat for ES.
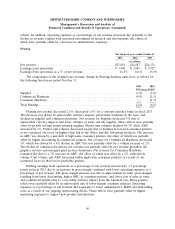
Selling, General and Administrative
SG&A expense decreased in fiscal 2013 due primarily to cost savings associated with our ongoing
restructuring efforts that impacted all of our segments. Partially offsetting the decline was higher
marketing expenses to support new product introductions and increased administrative expenses due in
part to higher consulting project spending. In fiscal 2013, SG&A expense as a percentage of revenue
increased for our EG, ES, HPFS, and Personal Systems segments, due in part to the revenue declines
taking place in these segments, and decreased for our Software and Printing segments.
SG&A expense decreased in fiscal 2012 due primarily to lower marketing costs and $103 million in
net gains from the sale of real estate in fiscal 2012. In fiscal 2012, SG&A expense as a percentage of
revenue increased for ES and Personal Systems, decreased for EG and Software and was flat for
Printing and HPFS.
Amortization of Intangible Assets
Amortization expense decreased in fiscal 2013 due primarily to the intangible asset impairment
recorded in the fourth quarter of fiscal 2012 related to Autonomy and certain intangible assets
associated with prior acquisitions reaching the end of their amortization periods.
Amortization expense increased in fiscal 2012 due primarily to the intangible assets purchased as
part of the Autonomy acquisition in the fourth quarter of fiscal 2011. The increase was partially offset
by decreased amortization expenses related to certain intangible assets associated with prior acquisitions
reaching the end of their amortization periods.
For more information on our amortization of intangible assets, see Note 6 to the Consolidated
Financial Statements in Item 8, which is incorporated herein by reference.
Impairment of Goodwill and Intangible Assets
In fiscal 2012, we recorded goodwill impairment charges of $8.0 billion and $5.7 billion associated
with ES and the acquisition of Autonomy, respectively. In addition, we recorded intangible asset
56