HP 2013 Annual Report Download - page 65
Download and view the complete annual report
Please find page 65 of the 2013 HP annual report below. You can navigate through the pages in the report by either clicking on the pages listed below, or by using the keyword search tool below to find specific information within the annual report.-
 1
1 -
2
-
3
-
4
-
5
-
6
-
7
-
8
-
9
-
10
-
11
-
12
-
13
-
14
-
15
-
16
-
17
-
18
-
19
-
20
-
21
-
22
-
23
-
24
-
25
-
26
-
27
-
28
-
29
-
30
-
31
-
32
-
33
-
34
-
35
-
36
-
37
-
38
-
39
-
40
-
41
-
42
-
43
-
44
-
45
-
46
-
47
-
48
-
49
-
50
-
51
-
52
-
53
-
54
-
 55
55 -
 56
56 -
 57
57 -
 58
58 -
 59
59 -
 60
60 -
 61
61 -
 62
62 -
 63
63 -
 64
64 -
 65
65 -
 66
66 -
 67
67 -
 68
68 -
 69
69 -
 70
70 -
 71
71 -
 72
72 -
 73
73 -
 74
74 -
 75
75 -
76
-
77
-
78
-
79
-
80
-
81
-
82
-
83
-
84
-
85
-
86
-
87
-
88
-
89
-
90
-
91
-
92
-
93
-
94
-
95
-
96
-
97
-
98
-
99
-
100
-
101
-
102
-
103
-
104
-
105
-
106
-
107
-
108
-
109
-
110
-
111
-
112
-
113
-
114
-
115
-
116
-
117
-
118
-
119
-
120
-
121
-
122
-
123
-
124
-
125
-
126
-
127
-
128
-
129
-
130
-
131
-
132
-
133
-
134
-
135
-
136
-
137
-
138
-
139
-
140
-
141
-
142
-
143
-
144
-
145
-
146
-
147
-
148
-
149
-
150
-
151
-
152
-
153
-
154
-
155
-
156
-
157
-
158
-
159
-
160
-
161
-
162
-
163
-
164
-
165
-
166
-
167
-
168
-
169
-
170
-
171
-
172
-
173
-
174
-
175
-
176
-
177
-
178
-
179
-
180
-
181
-
182
-
183
-
184
-
185
-
186
-
187
-
188
-
189
-
190
-
191
-
192
-
193
-
194
-
195
-
196
-
197
-
198
-
199
-
200
-
201
-
202
-
203
-
204
 |
 |
HEWLETT-PACKARD COMPANY AND SUBSIDIARIES
Management’s Discussion and Analysis of
Financial Condition and Results of Operations (Continued)
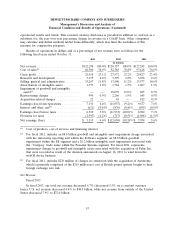
impairment charges of $3.1 billion and $1.2 billion associated with the acquisition of Autonomy and the
‘‘Compaq’’ trade name, respectively.
For more information on our impairment charges, see Note 6 to the Consolidated Financial
Statements in Item 8, which is incorporated herein by reference.
Restructuring Charges
Restructuring charges decreased in fiscal 2013 due primarily to the $2.1 billion charge recorded in
fiscal 2012 for the restructuring plan announced in May 2012 (the ‘‘2012 Plan’’). Restructuring charges
for fiscal 2013 were approximately $1.0 billion, which included $1.2 billion of charges related to the
2012 Plan that were partially offset by a reversal of $190 million of severance charges related to our
fiscal 2010 ES restructuring plan.
Restructuring charges increased in fiscal 2012 due primarily to the $2.1 billion charge for the 2012
Plan, the effect of which was partially offset by lower charges from the fiscal 2008 and fiscal 2010 ES
restructuring plans. Restructuring charges for fiscal 2012 were $2.3 billion which included $2.1 billion of
costs related to the 2012 Plan, $106 million of costs related to our fiscal 2008 restructuring plan and
$75 million of costs related to our fiscal 2010 ES restructuring plan.
For more information on our restructuring charges, see Note 7 to the Consolidated Financial
Statements in Item 8, which is incorporated herein by reference.
As part of our ongoing business operations, we incur workforce rebalancing charges for severance
and related costs. Workforce rebalancing activities are considered part of normal operations as we
continue to optimize our cost structure. Workforce rebalancing costs are included in our business
segment results, and we expect to incur additional workforce rebalancing costs in the future.
Acquisition-Related Charges
In fiscal 2013, 2012 and 2011, we recorded acquisition-related charges of $22 million, $45 million
and $182 million, respectively. The decrease in fiscal 2013 and 2012 was due primarily to lower
consulting and integration costs associated with the Autonomy acquisition and a reduced level of
acquisition activity.
Interest and Other, Net
Interest and other, net decreased by $255 million in fiscal 2013. The decrease was driven primarily
by lower currency transaction losses coupled with lower interest expense due to lower average debt
balances, a gain on sale of investments and lower investment losses.
Interest and other, net increased by $181 million in fiscal 2012. The increase was driven primarily
by higher interest expense due to higher average debt balances and higher currency transaction losses.
Provision for Taxes
Our effective tax rates were 21.5%, (6.0)% and 21.2% in fiscal 2013, 2012 and 2011, respectively.
Our effective tax rate generally differs from the U.S. federal statutory rate of 35% due to favorable tax
rates associated with certain earnings from our operations in lower-tax jurisdictions throughout the
world. The jurisdictions with favorable tax rates that have the most significant effective tax rate impact
in the periods presented include China, Ireland, the Netherlands, Puerto Rico and Singapore. We plan
to reinvest some of the earnings of these jurisdictions indefinitely outside the United States and
therefore have not provided U.S. taxes on those indefinitely reinvested earnings.
57