HP 2013 Annual Report Download - page 60
Download and view the complete annual report
Please find page 60 of the 2013 HP annual report below. You can navigate through the pages in the report by either clicking on the pages listed below, or by using the keyword search tool below to find specific information within the annual report.-
 1
1 -
2
-
3
-
4
-
5
-
6
-
7
-
8
-
9
-
10
-
11
-
12
-
13
-
14
-
15
-
16
-
17
-
18
-
19
-
20
-
21
-
22
-
23
-
24
-
25
-
26
-
27
-
28
-
29
-
30
-
31
-
32
-
33
-
34
-
35
-
36
-
37
-
38
-
39
-
40
-
41
-
42
-
43
-
44
-
45
-
46
-
47
-
48
-
49
-
 50
50 -
 51
51 -
 52
52 -
 53
53 -
 54
54 -
 55
55 -
 56
56 -
 57
57 -
 58
58 -
 59
59 -
 60
60 -
 61
61 -
 62
62 -
 63
63 -
 64
64 -
 65
65 -
 66
66 -
 67
67 -
 68
68 -
 69
69 -
 70
70 -
71
-
72
-
73
-
74
-
75
-
76
-
77
-
78
-
79
-
80
-
81
-
82
-
83
-
84
-
85
-
86
-
87
-
88
-
89
-
90
-
91
-
92
-
93
-
94
-
95
-
96
-
97
-
98
-
99
-
100
-
101
-
102
-
103
-
104
-
105
-
106
-
107
-
108
-
109
-
110
-
111
-
112
-
113
-
114
-
115
-
116
-
117
-
118
-
119
-
120
-
121
-
122
-
123
-
124
-
125
-
126
-
127
-
128
-
129
-
130
-
131
-
132
-
133
-
134
-
135
-
136
-
137
-
138
-
139
-
140
-
141
-
142
-
143
-
144
-
145
-
146
-
147
-
148
-
149
-
150
-
151
-
152
-
153
-
154
-
155
-
156
-
157
-
158
-
159
-
160
-
161
-
162
-
163
-
164
-
165
-
166
-
167
-
168
-
169
-
170
-
171
-
172
-
173
-
174
-
175
-
176
-
177
-
178
-
179
-
180
-
181
-
182
-
183
-
184
-
185
-
186
-
187
-
188
-
189
-
190
-
191
-
192
-
193
-
194
-
195
-
196
-
197
-
198
-
199
-
200
-
201
-
202
-
203
-
204
 |
 |
HEWLETT-PACKARD COMPANY AND SUBSIDIARIES
Management’s Discussion and Analysis of
Financial Condition and Results of Operations (Continued)
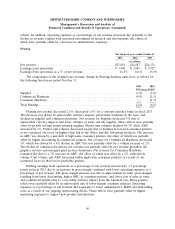
differences between target and actual investment allocations, the timing of benefit payments compared
to expectations, and the use of derivatives intended to effect asset allocation changes or hedge certain
investment or liability exposures. For the recognition of net periodic benefit cost, the calculation of the
expected long-term return on plan assets uses the fair value of plan assets as of the beginning of the
fiscal year.
Our major assumptions vary by plan, and the weighted-average rates used are set forth in Note 15
to the Consolidated Financial Statements in Item 8, which is incorporated herein by reference. For
fiscal 2013, changes in the weighted-average assumptions would have had the following impact on our
net periodic benefit cost:
• A decrease of 25 basis points in the expected long-term rate of return would have increased our
net periodic benefit cost by approximately $65 million;
• A decrease of 25 basis points in the discount rate would have increased our net periodic benefit
cost by approximately $75 million; and
• An increase of 25 basis points in the future compensation growth rate would have increased our
net periodic benefit cost by approximately $18 million.
Loss Contingencies
We are involved in various lawsuits, claims, investigations and proceedings that arise in the
ordinary course of business. We record a liability when we believe that it is both probable that a
liability has been incurred and the amount of loss can be reasonably estimated. Significant judgment is
required to determine both the probability of having incurred a liability and the estimated amount of
the liability. We review these matters at least quarterly and adjust these liabilities to reflect the impact
of negotiations, settlements, rulings, advice of legal counsel and updated information. For a further
discussion on litigation and contingencies, refer to Note 17 to the Consolidated Financial Statements in
Item 8, which is incorporated herein by reference.
ACCOUNTING PRONOUNCEMENTS
For a summary of recent accounting pronouncements with application to our consolidated financial
statements see Note 1 to the Consolidated Financial Statements in Item 8, which is incorporated herein
by reference.
RESULTS OF OPERATIONS
The following discussion compares the historical results of operations for the fiscal years ended
October 31, 2013, 2012 and 2011. Unless otherwise noted, all comparative performance data included
below reflect year-over-year comparisons.
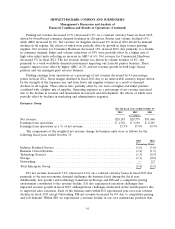
Revenue from our international operations has historically represented, and we expect will
continue to represent, a majority of our overall net revenue. As a result, our revenue growth has been
impacted, and we expect will continue to be impacted, by fluctuations in foreign currency exchange
rates. In order to provide a framework for assessing how each of our business segments performed
excluding the impact of foreign currency fluctuations, we present the year-over-year percentage change
in revenue on a constant currency basis, which assumes no change in the exchange rate from the
prior-year period. This information is provided so that revenue can be viewed without the impact of
fluctuations in foreign currency rates, which is consistent with how management evaluates our
52