HP 2013 Annual Report Download - page 76
Download and view the complete annual report
Please find page 76 of the 2013 HP annual report below. You can navigate through the pages in the report by either clicking on the pages listed below, or by using the keyword search tool below to find specific information within the annual report.-
 1
1 -
2
-
3
-
4
-
5
-
6
-
7
-
8
-
9
-
10
-
11
-
12
-
13
-
14
-
15
-
16
-
17
-
18
-
19
-
20
-
21
-
22
-
23
-
24
-
25
-
26
-
27
-
28
-
29
-
30
-
31
-
32
-
33
-
34
-
35
-
36
-
37
-
38
-
39
-
40
-
41
-
42
-
43
-
44
-
45
-
46
-
47
-
48
-
49
-
50
-
51
-
52
-
53
-
54
-
55
-
56
-
57
-
58
-
59
-
60
-
61
-
62
-
63
-
64
-
65
-
 66
66 -
 67
67 -
 68
68 -
 69
69 -
 70
70 -
 71
71 -
 72
72 -
 73
73 -
 74
74 -
 75
75 -
 76
76 -
 77
77 -
 78
78 -
 79
79 -
 80
80 -
 81
81 -
 82
82 -
 83
83 -
 84
84 -
 85
85 -
 86
86 -
87
-
88
-
89
-
90
-
91
-
92
-
93
-
94
-
95
-
96
-
97
-
98
-
99
-
100
-
101
-
102
-
103
-
104
-
105
-
106
-
107
-
108
-
109
-
110
-
111
-
112
-
113
-
114
-
115
-
116
-
117
-
118
-
119
-
120
-
121
-
122
-
123
-
124
-
125
-
126
-
127
-
128
-
129
-
130
-
131
-
132
-
133
-
134
-
135
-
136
-
137
-
138
-
139
-
140
-
141
-
142
-
143
-
144
-
145
-
146
-
147
-
148
-
149
-
150
-
151
-
152
-
153
-
154
-
155
-
156
-
157
-
158
-
159
-
160
-
161
-
162
-
163
-
164
-
165
-
166
-
167
-
168
-
169
-
170
-
171
-
172
-
173
-
174
-
175
-
176
-
177
-
178
-
179
-
180
-
181
-
182
-
183
-
184
-
185
-
186
-
187
-
188
-
189
-
190
-
191
-
192
-
193
-
194
-
195
-
196
-
197
-
198
-
199
-
200
-
201
-
202
-
203
-
204
 |
 |

HEWLETT-PACKARD COMPANY AND SUBSIDIARIES
Management’s Discussion and Analysis of
Financial Condition and Results of Operations (Continued)
could be repatriated to the United States but, under current law, would be subject to U.S. federal
income taxes, less applicable foreign tax credits. Repatriation of some foreign balances is restricted by
local laws. Except for foreign earnings that are considered indefinitely reinvested outside of the United
States, we have provided for the U.S. federal tax liability on these earnings for financial statement
purposes. Repatriation could result in additional income tax payments in future years. Where local
restrictions prevent an efficient intercompany transfer of funds, our intent is that cash balances would
remain outside of the United States and we would meet liquidity needs through ongoing cash flows,
external borrowings, or both. We do not expect restrictions or potential taxes incurred on repatriation
of amounts held outside of the United States to have a material effect on our overall liquidity, financial
condition or results of operations.
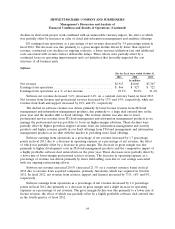
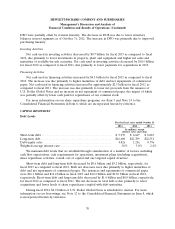
LIQUIDITY
Our cash and cash equivalents, total debt and available borrowing resources for each of the three
years ended October 31, were as follows:
For the fiscal years ended October 31
2013 2012 2011
In billions
Cash and cash equivalents ................................. $12.2 $11.3 $ 8.0
Total debt ............................................. $22.6 $28.4 $30.6
Available borrowing resources(1)(2) ............................ $17.8 $17.4 $14.6
(1) In addition to these available borrowing resources, we are able to offer for sale, from time to time,
in one or more offerings, an unspecified amount of debt securities, common stock, preferred stock,
depositary shares and warrants under a shelf registration statement filed with the Securities and
Exchange Commission in May 2012 (the ‘‘2012 Shelf Registration Statement’’).
(2) Available borrowing resources does not include £2.2 billion ($3.6 billion) in borrowing resources
under our 364-day senior unsecured bridge term loan agreement that was entered into in August
2011 and terminated in November 2011.
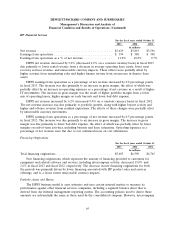
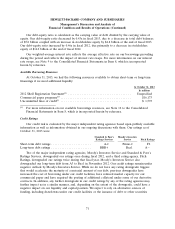
Sources and Uses of Cash
The following table summarizes the key cash flow metrics from our consolidated statements of
cash flow:
For the fiscal years ended October 31
2013 2012 2011
In millions
Net cash provided by operating activities ..................... $11,608 $10,571 $ 12,639
Net cash used in investing activities ......................... (2,803) (3,453) (13,959)
Net cash used in financing activities ......................... (7,943) (3,860) (1,566)
Net increase (decrease) in cash and cash equivalents ............. $ 862 $ 3,258 $ (2,886)
68