HP 2013 Annual Report Download - page 106
Download and view the complete annual report
Please find page 106 of the 2013 HP annual report below. You can navigate through the pages in the report by either clicking on the pages listed below, or by using the keyword search tool below to find specific information within the annual report.-
 1
1 -
2
-
3
-
4
-
5
-
6
-
7
-
8
-
9
-
10
-
11
-
12
-
13
-
14
-
15
-
16
-
17
-
18
-
19
-
20
-
21
-
22
-
23
-
24
-
25
-
26
-
27
-
28
-
29
-
30
-
31
-
32
-
33
-
34
-
35
-
36
-
37
-
38
-
39
-
40
-
41
-
42
-
43
-
44
-
45
-
46
-
47
-
48
-
49
-
50
-
51
-
52
-
53
-
54
-
55
-
56
-
57
-
58
-
59
-
60
-
61
-
62
-
63
-
64
-
65
-
66
-
67
-
68
-
69
-
70
-
71
-
72
-
73
-
74
-
75
-
76
-
77
-
78
-
79
-
80
-
81
-
82
-
83
-
84
-
85
-
86
-
87
-
88
-
89
-
90
-
91
-
92
-
93
-
94
-
95
-
 96
96 -
 97
97 -
 98
98 -
 99
99 -
 100
100 -
 101
101 -
 102
102 -
 103
103 -
 104
104 -
 105
105 -
 106
106 -
 107
107 -
 108
108 -
 109
109 -
 110
110 -
 111
111 -
 112
112 -
 113
113 -
 114
114 -
 115
115 -
 116
116 -
117
-
118
-
119
-
120
-
121
-
122
-
123
-
124
-
125
-
126
-
127
-
128
-
129
-
130
-
131
-
132
-
133
-
134
-
135
-
136
-
137
-
138
-
139
-
140
-
141
-
142
-
143
-
144
-
145
-
146
-
147
-
148
-
149
-
150
-
151
-
152
-
153
-
154
-
155
-
156
-
157
-
158
-
159
-
160
-
161
-
162
-
163
-
164
-
165
-
166
-
167
-
168
-
169
-
170
-
171
-
172
-
173
-
174
-
175
-
176
-
177
-
178
-
179
-
180
-
181
-
182
-
183
-
184
-
185
-
186
-
187
-
188
-
189
-
190
-
191
-
192
-
193
-
194
-
195
-
196
-
197
-
198
-
199
-
200
-
201
-
202
-
203
-
204
 |
 |

HEWLETT-PACKARD COMPANY AND SUBSIDIARIES
Notes to Consolidated Financial Statements (Continued)
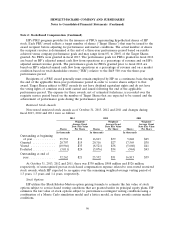
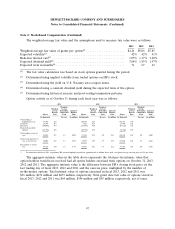
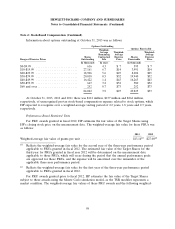
Note 2: Stock-Based Compensation (Continued)
Information about options outstanding at October 31, 2013 was as follows:
Options Outstanding
Options Exercisable
Weighted-
Average Weighted- Weighted-
Remaining Average Average
Shares Contractual Exercise Shares Exercise
Range of Exercise Prices Outstanding Life Price Exercisable Price
In thousands In years In thousands
$0-$9.99 .......................... 616 4.3 $ 7 595 $ 7
$10-$19.99 ........................ 27,161 6.7 $14 3,991 $14
$20-$29.99 ........................ 18,906 5.6 $25 8,204 $25
$30-$39.99 ........................ 20,018 0.5 $32 19,940 $32
$40-$49.99 ........................ 16,422 1.4 $43 16,263 $43
$50-$59.99 ........................ 667 3.2 $52 580 $52
$60 and over ....................... 252 0.7 $73 252 $73
84,042 3.9 $27 49,825 $33
At October 31, 2013, 2012 and 2011 there was $112 million, $157 million and $264 million,
respectively, of unrecognized pre-tax stock-based compensation expense related to stock options, which
HP expected to recognize over a weighted-average vesting period of 2.2 years, 1.8 years and 2.3 years,
respectively.
Performance-Based Restricted Units
For PRU awards granted in fiscal 2012, HP estimates the fair value of the Target Shares using
HP’s closing stock price on the measurement date. The weighted-average fair value for these PRUs was
as follows:
2013 2012
Weighted-average fair value of grants per unit ............................ $13.14(1) $27.00(2)
(1) Reflects the weighted-average fair value for the second year of the three-year performance period
applicable to PRUs granted in fiscal 2012. The estimated fair value of the Target Shares for the
third year for PRUs granted in fiscal year 2012 will be determined on the measurement date
applicable to those PRUs, which will occur during the period that the annual performance goals
are approved for those PRUs, and the expense will be amortized over the remainder of the
applicable three-year performance period.
(2) Reflects the weighted-average fair value for the first year of the three-year performance period
applicable to PRUs granted in fiscal 2012.
For PRU awards granted prior to fiscal 2012, HP estimates the fair value of the Target Shares
subject to those awards using the Monte Carlo simulation model, as the TSR modifier represents a
market condition. The weighted-average fair values of these PRU awards and the following weighted-
98