HP 2013 Annual Report Download - page 75
Download and view the complete annual report
Please find page 75 of the 2013 HP annual report below. You can navigate through the pages in the report by either clicking on the pages listed below, or by using the keyword search tool below to find specific information within the annual report.-
 1
1 -
2
-
3
-
4
-
5
-
6
-
7
-
8
-
9
-
10
-
11
-
12
-
13
-
14
-
15
-
16
-
17
-
18
-
19
-
20
-
21
-
22
-
23
-
24
-
25
-
26
-
27
-
28
-
29
-
30
-
31
-
32
-
33
-
34
-
35
-
36
-
37
-
38
-
39
-
40
-
41
-
42
-
43
-
44
-
45
-
46
-
47
-
48
-
49
-
50
-
51
-
52
-
53
-
54
-
55
-
56
-
57
-
58
-
59
-
60
-
61
-
62
-
63
-
64
-
 65
65 -
 66
66 -
 67
67 -
 68
68 -
 69
69 -
 70
70 -
 71
71 -
 72
72 -
 73
73 -
 74
74 -
 75
75 -
 76
76 -
 77
77 -
 78
78 -
 79
79 -
 80
80 -
 81
81 -
 82
82 -
 83
83 -
 84
84 -
 85
85 -
86
-
87
-
88
-
89
-
90
-
91
-
92
-
93
-
94
-
95
-
96
-
97
-
98
-
99
-
100
-
101
-
102
-
103
-
104
-
105
-
106
-
107
-
108
-
109
-
110
-
111
-
112
-
113
-
114
-
115
-
116
-
117
-
118
-
119
-
120
-
121
-
122
-
123
-
124
-
125
-
126
-
127
-
128
-
129
-
130
-
131
-
132
-
133
-
134
-
135
-
136
-
137
-
138
-
139
-
140
-
141
-
142
-
143
-
144
-
145
-
146
-
147
-
148
-
149
-
150
-
151
-
152
-
153
-
154
-
155
-
156
-
157
-
158
-
159
-
160
-
161
-
162
-
163
-
164
-
165
-
166
-
167
-
168
-
169
-
170
-
171
-
172
-
173
-
174
-
175
-
176
-
177
-
178
-
179
-
180
-
181
-
182
-
183
-
184
-
185
-
186
-
187
-
188
-
189
-
190
-
191
-
192
-
193
-
194
-
195
-
196
-
197
-
198
-
199
-
200
-
201
-
202
-
203
-
204
 |
 |

HEWLETT-PACKARD COMPANY AND SUBSIDIARIES
Management’s Discussion and Analysis of
Financial Condition and Results of Operations (Continued)
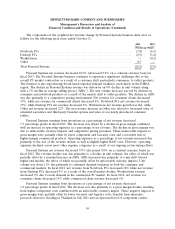
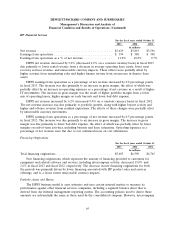
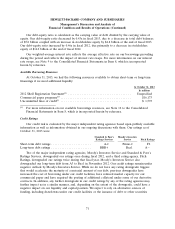
Corporate Investments
For the fiscal years ended October 31
2013 2012 2011
In millions
Net revenue .......................................... $ 24 $ 58 $ 166
Loss from operations .................................... $(236) $(233) $(1,633)
Loss from operations as a % of net revenue ................... N/M N/M N/M
In fiscal 2013, Corporate Investments net revenue was primarily related to licensing revenue from
HP Labs. Net revenue decreased from fiscal 2012 due primarily to lower residual activity from the
webOS device business and lower revenue from business intelligence products.
Costs and expenses in Corporate Investments are due to activities in the segment from residual
activity related to the webOS device business, HP Labs, certain incubation projects, corporate strategy,
and global alliances.
In fiscal 2012, the revenue decrease in Corporate Investments was a result of lower sales due to
the wind down of the webOS device business announced in August 2011.
Corporate Investments reported a smaller loss from operations in fiscal 2012 due primarily to the
recognition of charges in fiscal 2011 related to the wind down of the webOS device business. The loss
from operations in Corporate Investments was also due to expenses associated with corporate strategy,
global alliances and HP Labs.
LIQUIDITY AND CAPITAL RESOURCES
We use cash generated by operations as our primary source of liquidity. We believe that internally
generated cash flows are generally sufficient to support our operating businesses, capital expenditures,
restructuring activities, maturing debt, income tax payments and the payment of stockholder dividends,
in addition to discretionary investments and share repurchases. We are able to supplement this
short-term liquidity, if necessary, with broad access to capital markets and credit line facilities made
available by various foreign and domestic financial institutions. Our access to capital markets may be
constrained and our cost of borrowing may increase under certain business, market and economic
conditions; however, our use of a variety of funding sources to meet our liquidity needs is designed to
facilitate continued access to borrowing resources under all such conditions. Our liquidity is subject to
various risks including the risks identified in the section entitled ‘‘Risk Factors’’ in Item 1A and market
risks identified in the section entitled ‘‘Quantitative and Qualitative Disclosures about Market Risk’’ in
Item 7A.
Our cash balances are held in numerous locations throughout the world, with substantially all of
those amounts held outside of the United States. We utilize a variety of planning and financing
strategies in an effort to ensure that our worldwide cash is available when and where it is needed. Our
cash position remains strong, and we expect that our cash balances, anticipated cash flow generated
from operations and access to capital markets will be sufficient to cover our expected near-term cash
outlays.
Amounts held outside of the United States are generally utilized to support non-U.S. liquidity
needs, although a portion of those amounts may from time to time be subject to short-term
intercompany loans into the United States. Most of the amounts held outside of the United States
67