HP 2013 Annual Report Download - page 68
Download and view the complete annual report
Please find page 68 of the 2013 HP annual report below. You can navigate through the pages in the report by either clicking on the pages listed below, or by using the keyword search tool below to find specific information within the annual report.-
 1
1 -
2
-
3
-
4
-
5
-
6
-
7
-
8
-
9
-
10
-
11
-
12
-
13
-
14
-
15
-
16
-
17
-
18
-
19
-
20
-
21
-
22
-
23
-
24
-
25
-
26
-
27
-
28
-
29
-
30
-
31
-
32
-
33
-
34
-
35
-
36
-
37
-
38
-
39
-
40
-
41
-
42
-
43
-
44
-
45
-
46
-
47
-
48
-
49
-
50
-
51
-
52
-
53
-
54
-
55
-
56
-
57
-
 58
58 -
 59
59 -
 60
60 -
 61
61 -
 62
62 -
 63
63 -
 64
64 -
 65
65 -
 66
66 -
 67
67 -
 68
68 -
 69
69 -
 70
70 -
 71
71 -
 72
72 -
 73
73 -
 74
74 -
 75
75 -
 76
76 -
 77
77 -
 78
78 -
79
-
80
-
81
-
82
-
83
-
84
-
85
-
86
-
87
-
88
-
89
-
90
-
91
-
92
-
93
-
94
-
95
-
96
-
97
-
98
-
99
-
100
-
101
-
102
-
103
-
104
-
105
-
106
-
107
-
108
-
109
-
110
-
111
-
112
-
113
-
114
-
115
-
116
-
117
-
118
-
119
-
120
-
121
-
122
-
123
-
124
-
125
-
126
-
127
-
128
-
129
-
130
-
131
-
132
-
133
-
134
-
135
-
136
-
137
-
138
-
139
-
140
-
141
-
142
-
143
-
144
-
145
-
146
-
147
-
148
-
149
-
150
-
151
-
152
-
153
-
154
-
155
-
156
-
157
-
158
-
159
-
160
-
161
-
162
-
163
-
164
-
165
-
166
-
167
-
168
-
169
-
170
-
171
-
172
-
173
-
174
-
175
-
176
-
177
-
178
-
179
-
180
-
181
-
182
-
183
-
184
-
185
-
186
-
187
-
188
-
189
-
190
-
191
-
192
-
193
-
194
-
195
-
196
-
197
-
198
-
199
-
200
-
201
-
202
-
203
-
204
 |
 |

HEWLETT-PACKARD COMPANY AND SUBSIDIARIES
Management’s Discussion and Analysis of
Financial Condition and Results of Operations (Continued)
rebates. In addition, operating expenses as a percentage of net revenue increased due primarily to the
decline in revenue coupled with increased investments in research and development, the effects of
which were partially offset by a decrease in administrative expenses.
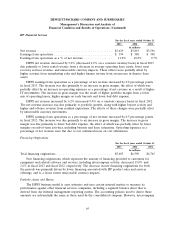
Printing
For the fiscal years ended October 31
2013 2012 2011
In millions
Net revenue ........................................... $23,854 $24,487 $26,176
Earnings from operations ................................. $ 3,890 $ 3,585 $ 3,927
Earnings from operations as a % of net revenue ................ 16.3% 14.6% 15.0%
The components of the weighted net revenue change by Printing business units were as follows for
the following fiscal years ended October 31:
2013 2012
Percentage Points
Supplies ......................................................... (1.8) (3.9)
Commercial Hardware ............................................... (0.8) (1.1)
Consumer Hardware ................................................ — (1.5)
Total Printing ..................................................... (2.6) (6.5)
Printing net revenue decreased 2.6% (decreased 1.0% on a constant currency basis) in fiscal 2013.
The decrease was driven by unfavorable currency impacts, particularly weakness in the euro, and
declines in supplies and commercial printers. Net revenue for Supplies decreased 3% due to
unfavorable currency impacts and lower volumes of toner and ink supplies. These effects were partially
offset by growth in large format printing supplies. Printer unit volumes declined by 3% while ARU
increased by 1%. Printer unit volumes decreased largely due to declines in low-end consumer printers
as we continued our focus on higher-value Ink in the Office and Ink Advantage products. The increase
in ARU was driven by a mix shift to high-value consumer printers, the effect of which was partially
offset by higher discounting in commercial printers. Net revenue for Commercial Hardware decreased
3%, which was driven by a 6% decline in ARU that was partially offset by a volume increase of 2%.
The decline in commercial hardware net revenue was partially offset by net revenue growth in the
graphics services and managed print services businesses. Net revenue for Consumer Hardware
remained flat due to a 7% increase in ARU, the effect of which was offset by a 5% reduction in
volume. Unit volume and ARU increased within high-value consumer printers as a result of our
continued focus on those more profitable printers.
Printing earnings from operations as a percentage of net revenue increased by 1.7 percentage
points in fiscal 2013 due to an increase in gross margin combined with lower operating expenses as a
percentage of net revenue. The gross margin increase was due to improvement in toner gross margins
resulting from lower discounting, higher ARU in consumer printers, and lower cost of sales in toner
and commercial printers due to a favorable currency impact from the Japanese yen. These positive
effects were partially offset by an unfavorable mix of lower-margin consumer printers. Operating
expenses as a percentage of net revenue decreased due to lower administrative, R&D and field selling
costs as a result of our ongoing restructuring efforts. These effects were partially offset by higher
marketing expenses to support new product introductions.
60