HP 2013 Annual Report Download - page 71
Download and view the complete annual report
Please find page 71 of the 2013 HP annual report below. You can navigate through the pages in the report by either clicking on the pages listed below, or by using the keyword search tool below to find specific information within the annual report.-
 1
1 -
2
-
3
-
4
-
5
-
6
-
7
-
8
-
9
-
10
-
11
-
12
-
13
-
14
-
15
-
16
-
17
-
18
-
19
-
20
-
21
-
22
-
23
-
24
-
25
-
26
-
27
-
28
-
29
-
30
-
31
-
32
-
33
-
34
-
35
-
36
-
37
-
38
-
39
-
40
-
41
-
42
-
43
-
44
-
45
-
46
-
47
-
48
-
49
-
50
-
51
-
52
-
53
-
54
-
55
-
56
-
57
-
58
-
59
-
60
-
 61
61 -
 62
62 -
 63
63 -
 64
64 -
 65
65 -
 66
66 -
 67
67 -
 68
68 -
 69
69 -
 70
70 -
 71
71 -
 72
72 -
 73
73 -
 74
74 -
 75
75 -
 76
76 -
 77
77 -
 78
78 -
 79
79 -
 80
80 -
 81
81 -
82
-
83
-
84
-
85
-
86
-
87
-
88
-
89
-
90
-
91
-
92
-
93
-
94
-
95
-
96
-
97
-
98
-
99
-
100
-
101
-
102
-
103
-
104
-
105
-
106
-
107
-
108
-
109
-
110
-
111
-
112
-
113
-
114
-
115
-
116
-
117
-
118
-
119
-
120
-
121
-
122
-
123
-
124
-
125
-
126
-
127
-
128
-
129
-
130
-
131
-
132
-
133
-
134
-
135
-
136
-
137
-
138
-
139
-
140
-
141
-
142
-
143
-
144
-
145
-
146
-
147
-
148
-
149
-
150
-
151
-
152
-
153
-
154
-
155
-
156
-
157
-
158
-
159
-
160
-
161
-
162
-
163
-
164
-
165
-
166
-
167
-
168
-
169
-
170
-
171
-
172
-
173
-
174
-
175
-
176
-
177
-
178
-
179
-
180
-
181
-
182
-
183
-
184
-
185
-
186
-
187
-
188
-
189
-
190
-
191
-
192
-
193
-
194
-
195
-
196
-
197
-
198
-
199
-
200
-
201
-
202
-
203
-
204
 |
 |

HEWLETT-PACKARD COMPANY AND SUBSIDIARIES
Management’s Discussion and Analysis of
Financial Condition and Results of Operations (Continued)
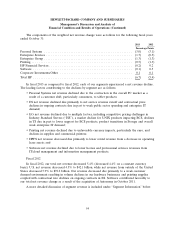
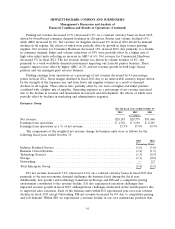
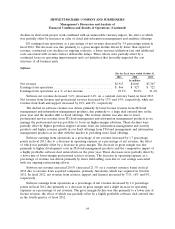
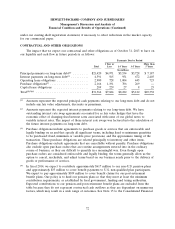
Enterprise Services
For fiscal years ended October 31
2013 2012 2011
In millions
Net revenue ........................................... $23,520 $25,609 $26,268
Earnings from operations ................................. $ 679 $ 1,045 $ 1,972
Earnings from operations as a % of net revenue ................ 2.9% 4.1% 7.5%
The components of the weighted net revenue change by ES business units were as follows for the
following fiscal years ended October 31:
2013 2012
Percentage Points
Infrastructure Technology Outsourcing ................................... (4.4) (1.9)
Application and Business Services ....................................... (3.8) (0.6)
Total Enterprise Services ............................................. (8.2) (2.5)
ES net revenue decreased 8.2% (decreased 7.1% on a constant currency basis) in fiscal 2013.
Revenue performance in ES continues to be challenged by several factors that impact the demand
environment, including weak public sector spending in the United States and austerity measures in
other countries, particularly in the United Kingdom, and weak IT services spend due to the mixed
global recovery, particularly in the EMEA region. The net revenue decrease in ES was driven primarily
by net service revenue runoff, contractual price declines in ongoing contracts and unfavorable currency
impacts. ITO net revenue decreased by 7% in fiscal 2013, due to net service revenue runoff,
contractual price declines in ongoing contracts and unfavorable currency impacts, the effects of which
were partially offset by net revenue growth in security and cloud offerings. ABS net revenue declined
10% in fiscal 2013. The net revenue decline was due primarily to net service revenue runoff and
unfavorable currency impacts, the effects of which were partially offset by revenue growth in cloud and
information and analytics offerings. Revenue in ABS was also negatively impacted by weakness in
public-sector spending.
ES earnings from operations as a percentage of net revenue decreased by 1.2 percentage points in
fiscal 2013. The decrease was due to a decline in gross margin combined with an increase in operating
expenses as a percentage of net revenue. Gross margin declined due primarily to net service revenue
runoff and contractual price declines. These unfavorable impacts to gross margin were partially offset
by our continued focus on improving resource management and profit improvements on under-
performing contracts. Operating expenses as a percentage of net revenue increased due to higher
administrative, marketing and R&D costs. These effects were partially offset by reduced field selling
costs due to lower headcount-related costs during the year and other savings from our ongoing
restructuring efforts.
ES net revenue decreased 2.5% (decreased 0.4% on a constant currency basis) in fiscal 2012 due
to revenue decreases in all business units. ITO net revenue decreased by 3% in fiscal 2012. Contractual
rate declines on ongoing contracts, increased deal selectivity designed to meet threshold margins and
strategic fit, and an unfavorable currency impact contributed to the decrease in revenues. These effects
were partially offset by an increase in product-related revenue and increased revenue from cloud and
security offerings. ABS net revenue decreased by 2% in fiscal 2012. The decrease was driven by
63