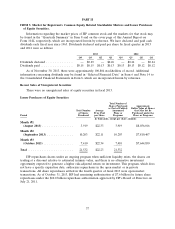
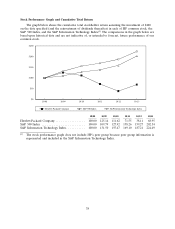
HP 2013 Annual Report Download - page 49
Download and view the complete annual report
Please find page 49 of the 2013 HP annual report below. You can navigate through the pages in the report by either clicking on the pages listed below, or by using the keyword search tool below to find specific information within the annual report.-
 1
1 -
2
-
3
-
4
-
5
-
6
-
7
-
8
-
9
-
10
-
11
-
12
-
13
-
14
-
15
-
16
-
17
-
18
-
19
-
20
-
21
-
22
-
23
-
24
-
25
-
26
-
27
-
28
-
29
-
30
-
31
-
32
-
33
-
34
-
35
-
36
-
37
-
38
-
 39
39 -
 40
40 -
 41
41 -
 42
42 -
 43
43 -
 44
44 -
 45
45 -
 46
46 -
 47
47 -
 48
48 -
 49
49 -
 50
50 -
 51
51 -
 52
52 -
 53
53 -
 54
54 -
 55
55 -
 56
56 -
 57
57 -
 58
58 -
 59
59 -
60
-
61
-
62
-
63
-
64
-
65
-
66
-
67
-
68
-
69
-
70
-
71
-
72
-
73
-
74
-
75
-
76
-
77
-
78
-
79
-
80
-
81
-
82
-
83
-
84
-
85
-
86
-
87
-
88
-
89
-
90
-
91
-
92
-
93
-
94
-
95
-
96
-
97
-
98
-
99
-
100
-
101
-
102
-
103
-
104
-
105
-
106
-
107
-
108
-
109
-
110
-
111
-
112
-
113
-
114
-
115
-
116
-
117
-
118
-
119
-
120
-
121
-
122
-
123
-
124
-
125
-
126
-
127
-
128
-
129
-
130
-
131
-
132
-
133
-
134
-
135
-
136
-
137
-
138
-
139
-
140
-
141
-
142
-
143
-
144
-
145
-
146
-
147
-
148
-
149
-
150
-
151
-
152
-
153
-
154
-
155
-
156
-
157
-
158
-
159
-
160
-
161
-
162
-
163
-
164
-
165
-
166
-
167
-
168
-
169
-
170
-
171
-
172
-
173
-
174
-
175
-
176
-
177
-
178
-
179
-
180
-
181
-
182
-
183
-
184
-
185
-
186
-
187
-
188
-
189
-
190
-
191
-
192
-
193
-
194
-
195
-
196
-
197
-
198
-
199
-
200
-
201
-
202
-
203
-
204
 |
 |

HEWLETT-PACKARD COMPANY AND SUBSIDIARIES
Management’s Discussion and Analysis of
Financial Condition and Results of Operations (Continued)
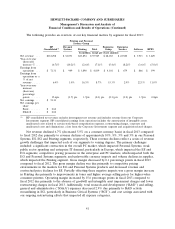
The following provides an overview of our key financial metrics by segment for fiscal 2013:
Printing and Personal
Systems Group
HP Personal Enterprise Enterprise
Consolidated(1) Systems Printing Total Group Services Software HPFS
In millions, except per share amounts
Net revenue . . . $112,298 $ 32,071 $23,854 $ 55,925 $ 28,183 $ 23,520 $ 3,913 $ 3,629
Year-over-year
(decrease)
increase % . . . (6.7)% (10.2)% (2.6)% (7.1)% (5.4)% (8.2)% (3.6)% (5.0)%
Earnings from
operations . . . $ 7,131 $ 949 $ 3,890 $ 4,839 $ 4,301 $ 679 $ 866 $ 399
Earnings from
operations as a
% of net
revenue ..... 6.4% 3.0% 16.3% 8.7% 15.3% 2.9% 22.1% 11.0%
Year-over-year
increase
(decrease)
percentage
points ...... 15.6pts (1.7) pts 1.7pts (0.1) pts (2.1) pts (1.2) pts 1.7pts 0.8pts
Net earnings . . . $ 5,113
Net earnings per
share
Basic ....... $ 2.64
Diluted ..... $ 2.62
(1) HP consolidated net revenue excludes intersegment net revenue and includes revenue from our Corporate
Investments segment. HP consolidated earnings from operations includes the amortization of intangible assets,
unallocated costs related to certain stock-based compensation expenses, restructuring charges, corporate and
unallocated costs and eliminations, a loss from the Corporate Investments segment and acquisition-related charges.
Net revenue declined 6.7% (decreased 5.5% on a constant currency basis) in fiscal 2013 compared
to fiscal 2012 due primarily to revenue declines of approximately 10%, 8%, 5% and 3% in our Personal
Systems, ES, EG and Printing segments, respectively. These revenue declines reflect a series of revenue
growth challenges that impacted each of our segments to varying degrees. The primary challenges
included: a significant contraction in the overall PC market, which impacted Personal Systems; weak
public sector spending and enterprise IT demand, particularly in Europe, which impacted the ES and
EG segments; competitive pricing pressures in the enterprise and PC markets, which impacted both the
EG and Personal Systems segments; and unfavorable currency impacts and volume declines in supplies,
which impacted the Printing segment. Gross margin decreased by 0.1 percentage points in fiscal 2013
compared to fiscal 2012. The gross margin decline was due primarily to competitive pricing
environments in the markets for EG and Personal Systems products and decreased revenue and
contractual price declines for ES. Partially offsetting these negative impacts was a gross margin increase
in Printing due primarily to improvements in toner and higher average selling prices for higher-value
consumer printers. Operating margin increased by 15.6 percentage points in fiscal 2013 compared to
fiscal 2012 due primarily to the absence of goodwill and intangible asset impairment charges and lower
restructuring charges in fiscal 2013. Additionally, total research and development (‘‘R&D’’) and selling,
general and administrative (‘‘SG&A’’) expenses decreased 2.9% due primarily to R&D activity
streamlining in EG, particularly in Business Critical Systems (‘‘BCS’’), and cost savings associated with
our ongoing restructuring efforts that impacted all expense categories.
41