HP 2013 Annual Report Download - page 172
Download and view the complete annual report
Please find page 172 of the 2013 HP annual report below. You can navigate through the pages in the report by either clicking on the pages listed below, or by using the keyword search tool below to find specific information within the annual report.-
 1
1 -
2
-
3
-
4
-
5
-
6
-
7
-
8
-
9
-
10
-
11
-
12
-
13
-
14
-
15
-
16
-
17
-
18
-
19
-
20
-
21
-
22
-
23
-
24
-
25
-
26
-
27
-
28
-
29
-
30
-
31
-
32
-
33
-
34
-
35
-
36
-
37
-
38
-
39
-
40
-
41
-
42
-
43
-
44
-
45
-
46
-
47
-
48
-
49
-
50
-
51
-
52
-
53
-
54
-
55
-
56
-
57
-
58
-
59
-
60
-
61
-
62
-
63
-
64
-
65
-
66
-
67
-
68
-
69
-
70
-
71
-
72
-
73
-
74
-
75
-
76
-
77
-
78
-
79
-
80
-
81
-
82
-
83
-
84
-
85
-
86
-
87
-
88
-
89
-
90
-
91
-
92
-
93
-
94
-
95
-
96
-
97
-
98
-
99
-
100
-
101
-
102
-
103
-
104
-
105
-
106
-
107
-
108
-
109
-
110
-
111
-
112
-
113
-
114
-
115
-
116
-
117
-
118
-
119
-
120
-
121
-
122
-
123
-
124
-
125
-
126
-
127
-
128
-
129
-
130
-
131
-
132
-
133
-
134
-
135
-
136
-
137
-
138
-
139
-
140
-
141
-
142
-
143
-
144
-
145
-
146
-
147
-
148
-
149
-
150
-
151
-
152
-
153
-
154
-
155
-
156
-
157
-
158
-
159
-
160
-
161
-
 162
162 -
 163
163 -
 164
164 -
 165
165 -
 166
166 -
 167
167 -
 168
168 -
 169
169 -
 170
170 -
 171
171 -
 172
172 -
 173
173 -
 174
174 -
 175
175 -
 176
176 -
 177
177 -
 178
178 -
 179
179 -
 180
180 -
 181
181 -
 182
182 -
183
-
184
-
185
-
186
-
187
-
188
-
189
-
190
-
191
-
192
-
193
-
194
-
195
-
196
-
197
-
198
-
199
-
200
-
201
-
202
-
203
-
204
 |
 |

HEWLETT-PACKARD COMPANY AND SUBSIDIARIES
Notes to Consolidated Financial Statements (Continued)
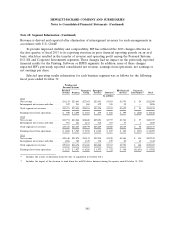
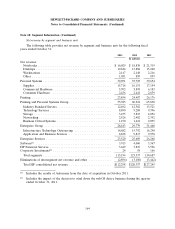
Note 18: Segment Information (Continued)
Net revenue by segment and business unit
The following table provides net revenue by segment and business unit for the following fiscal
years ended October 31:
2013 2012 2011
In millions
Net revenue:
Notebooks .......................................... $ 16,029 $ 18,830 $ 21,319
Desktops ........................................... 12,844 13,888 15,260
Workstations ........................................ 2,147 2,148 2,216
Other ............................................. 1,051 859 859
Personal Systems ....................................... 32,071 35,725 39,654
Supplies ........................................... 15,716 16,151 17,154
Commercial Hardware ................................. 5,702 5,895 6,183
Consumer Hardware .................................. 2,436 2,441 2,839
Printing ............................................. 23,854 24,487 26,176
Printing and Personal Systems Group ........................ 55,925 60,212 65,830
Industry Standard Servers ............................... 12,102 12,582 13,521
Technology Services ................................... 8,890 9,288 9,396
Storage ............................................ 3,475 3,815 4,056
Networking ......................................... 2,526 2,482 2,392
Business Critical Systems ............................... 1,190 1,612 2,095
Enterprise Group ...................................... 28,183 29,779 31,460
Infrastructure Technology Outsourcing ..................... 14,682 15,792 16,290
Application and Business Services ......................... 8,838 9,817 9,978
Enterprise Services ..................................... 23,520 25,609 26,268
Software(1) ........................................... 3,913 4,060 3,367
HP Financial Services ................................... 3,629 3,819 3,596
Corporate Investments(2) ................................. 24 58 166
Total segments ....................................... 115,194 123,537 130,687
Eliminations of intersegment net revenue and other ............. (2,896) (3,180) (3,442)
Total HP consolidated net revenue ........................ $112,298 $120,357 $127,245
(1) Includes the results of Autonomy from the date of acquisition in October 2011.
(2) Includes the impact of the decision to wind down the webOS device business during the quarter
ended October 31, 2011.
164