HP 2013 Annual Report Download - page 70
Download and view the complete annual report
Please find page 70 of the 2013 HP annual report below. You can navigate through the pages in the report by either clicking on the pages listed below, or by using the keyword search tool below to find specific information within the annual report.-
 1
1 -
2
-
3
-
4
-
5
-
6
-
7
-
8
-
9
-
10
-
11
-
12
-
13
-
14
-
15
-
16
-
17
-
18
-
19
-
20
-
21
-
22
-
23
-
24
-
25
-
26
-
27
-
28
-
29
-
30
-
31
-
32
-
33
-
34
-
35
-
36
-
37
-
38
-
39
-
40
-
41
-
42
-
43
-
44
-
45
-
46
-
47
-
48
-
49
-
50
-
51
-
52
-
53
-
54
-
55
-
56
-
57
-
58
-
59
-
 60
60 -
 61
61 -
 62
62 -
 63
63 -
 64
64 -
 65
65 -
 66
66 -
 67
67 -
 68
68 -
 69
69 -
 70
70 -
 71
71 -
 72
72 -
 73
73 -
 74
74 -
 75
75 -
 76
76 -
 77
77 -
 78
78 -
 79
79 -
 80
80 -
81
-
82
-
83
-
84
-
85
-
86
-
87
-
88
-
89
-
90
-
91
-
92
-
93
-
94
-
95
-
96
-
97
-
98
-
99
-
100
-
101
-
102
-
103
-
104
-
105
-
106
-
107
-
108
-
109
-
110
-
111
-
112
-
113
-
114
-
115
-
116
-
117
-
118
-
119
-
120
-
121
-
122
-
123
-
124
-
125
-
126
-
127
-
128
-
129
-
130
-
131
-
132
-
133
-
134
-
135
-
136
-
137
-
138
-
139
-
140
-
141
-
142
-
143
-
144
-
145
-
146
-
147
-
148
-
149
-
150
-
151
-
152
-
153
-
154
-
155
-
156
-
157
-
158
-
159
-
160
-
161
-
162
-
163
-
164
-
165
-
166
-
167
-
168
-
169
-
170
-
171
-
172
-
173
-
174
-
175
-
176
-
177
-
178
-
179
-
180
-
181
-
182
-
183
-
184
-
185
-
186
-
187
-
188
-
189
-
190
-
191
-
192
-
193
-
194
-
195
-
196
-
197
-
198
-
199
-
200
-
201
-
202
-
203
-
204
 |
 |
HEWLETT-PACKARD COMPANY AND SUBSIDIARIES
Management’s Discussion and Analysis of
Financial Condition and Results of Operations (Continued)
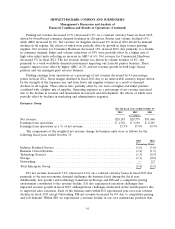
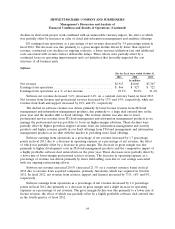
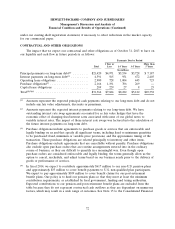
was partially offset by revenue growth in our hyperscale server products. TS net revenue decreased by
4% due to revenue declines in the support and consulting businesses and, to a lesser extent, to
unfavorable currency impacts. Support revenue declined due to a reduction in support for BCS
products. The consulting revenue decline was a result of unfavorable currency impacts, the divestiture
of a service product line and a shift to more profitable services such as data center and storage
consulting. BCS net revenue decreased by 26% as a result of ongoing pressures from the decline in the
overall UNIX market along with lower demand for our Itanium-based servers. Storage net revenue
decreased by 9% due to declines in traditional storage products, which include our tape, storage
networking, and legacy external disk products, the effects of which were partially offset by growth in
Converged Storage solutions, which include our 3PAR, StoreOnce, StoreVirtual and StoreAll products.
Networking revenue increased by 2% due to higher demand for our switching, routing, and wireless
products, the effect of which was partially offset by the impact of the divestiture of our video
surveillance business in the first quarter of fiscal 2012.
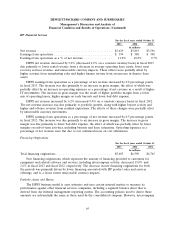
EG earnings from operations as a percentage of net revenue decreased by 2.1 percentage points in
fiscal 2013 driven by a decrease in gross margin and, to a lesser extent, an increase in operating
expenses as a percentage of net revenue. The gross margin decrease was due primarily to competitive
pricing pressures in ISS and, to a lesser extent, pricing pressures in Storage and mix impacts from lower
BCS revenue. Operating expenses as a percentage of net revenue increased due to the decline in EG
net revenue and increased field selling costs and administrative expenses. R&D expenses as a
percentage of net revenue decreased due primarily to the rationalization of R&D specifically for BCS
and a value-added tax subsidy credit in BCS. EG also benefitted from cost savings resulting from our
ongoing restructuring efforts.
EG net revenue decreased 5.3% (decreased 4.6% on a constant currency basis) in fiscal 2012 due
primarily to revenue decreases in ISS, BCS, Storage and TS. In fiscal 2012, ISS net revenue decreased
by 7% driven by declines in unit volume and average unit prices. The declines were due primarily to
competitive pricing pressures and macroeconomic challenges in EMEA. These effects were partially
offset by increased demand for public and private cloud offerings. BCS net revenue decreased by 23%
in fiscal 2012 mainly as a result of lower demand for our Itanium-based servers, the impact of which
was slightly offset by growth in NonStop servers. Storage net revenue decreased 6% in fiscal 2012, due
primarily to revenue declines in storage tape and storage networking products, the effect of which was
partially offset by strong growth in 3PAR products and StoreOnce data deduplication solutions. TS net
revenue decreased by 1% in fiscal 2012, due primarily to revenue declines in our support business
driven by an unfavorable currency impact. Support contract renewals remained steady while declines in
third-party hardware support were offset by growth in project services. Networking net revenue
increased 4% in fiscal 2012 due to higher market demand for our core data center products, the effect
of which was partially offset by competitive pricing pressures and the divestiture of our video
surveillance business.
EG earnings from operations as a percentage of net revenue decreased by 2.5 percentage points in
fiscal 2012 driven by a decrease in gross margin coupled with an increase in operating expenses as a
percentage of net revenue. The decrease in gross margin was due primarily to competitive pricing
pressures, particularly in ISS and, to a lesser extent, in Networking. The increase in operating expenses
as a percentage of net revenue was driven by an increase in research and development costs and field
selling costs, the effect of which was partially offset by lower administrative expenses.
62