HP 2013 Annual Report Download - page 169
Download and view the complete annual report
Please find page 169 of the 2013 HP annual report below. You can navigate through the pages in the report by either clicking on the pages listed below, or by using the keyword search tool below to find specific information within the annual report.-
 1
1 -
2
-
3
-
4
-
5
-
6
-
7
-
8
-
9
-
10
-
11
-
12
-
13
-
14
-
15
-
16
-
17
-
18
-
19
-
20
-
21
-
22
-
23
-
24
-
25
-
26
-
27
-
28
-
29
-
30
-
31
-
32
-
33
-
34
-
35
-
36
-
37
-
38
-
39
-
40
-
41
-
42
-
43
-
44
-
45
-
46
-
47
-
48
-
49
-
50
-
51
-
52
-
53
-
54
-
55
-
56
-
57
-
58
-
59
-
60
-
61
-
62
-
63
-
64
-
65
-
66
-
67
-
68
-
69
-
70
-
71
-
72
-
73
-
74
-
75
-
76
-
77
-
78
-
79
-
80
-
81
-
82
-
83
-
84
-
85
-
86
-
87
-
88
-
89
-
90
-
91
-
92
-
93
-
94
-
95
-
96
-
97
-
98
-
99
-
100
-
101
-
102
-
103
-
104
-
105
-
106
-
107
-
108
-
109
-
110
-
111
-
112
-
113
-
114
-
115
-
116
-
117
-
118
-
119
-
120
-
121
-
122
-
123
-
124
-
125
-
126
-
127
-
128
-
129
-
130
-
131
-
132
-
133
-
134
-
135
-
136
-
137
-
138
-
139
-
140
-
141
-
142
-
143
-
144
-
145
-
146
-
147
-
148
-
149
-
150
-
151
-
152
-
153
-
154
-
155
-
156
-
157
-
158
-
 159
159 -
 160
160 -
 161
161 -
 162
162 -
 163
163 -
 164
164 -
 165
165 -
 166
166 -
 167
167 -
 168
168 -
 169
169 -
 170
170 -
 171
171 -
 172
172 -
 173
173 -
 174
174 -
 175
175 -
 176
176 -
 177
177 -
 178
178 -
 179
179 -
180
-
181
-
182
-
183
-
184
-
185
-
186
-
187
-
188
-
189
-
190
-
191
-
192
-
193
-
194
-
195
-
196
-
197
-
198
-
199
-
200
-
201
-
202
-
203
-
204
 |
 |

HEWLETT-PACKARD COMPANY AND SUBSIDIARIES
Notes to Consolidated Financial Statements (Continued)
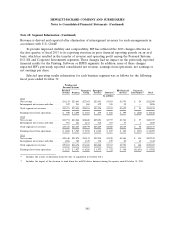
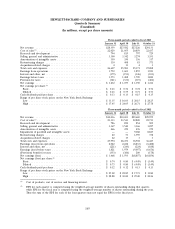
Note 18: Segment Information (Continued)
Revenue is derived and reported after elimination of intersegment revenues for such arrangements in
accordance with U.S. GAAP.
To provide improved visibility and comparability, HP has reflected the 2013 changes effective in
the first quarter of fiscal 2013 to its reporting structure in prior financial reporting periods on an as-if
basis, which has resulted in the transfer of revenue and operating profit among the Personal Systems,
EG, ES and Corporate Investments segments. These changes had no impact on the previously reported
financial results for the Printing, Software or HPFS segments. In addition, none of these changes
impacted HP’s previously reported consolidated net revenue, earnings from operations, net earnings or
net earnings per share.
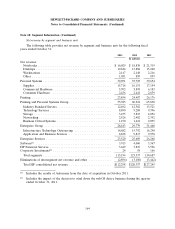
Selected operating results information for each business segment was as follows for the following
fiscal years ended October 31:
Printing and
Personal Systems
Personal Enterprise Enterprise HP Financial Corporate
Systems Printing Group Services Software(1) Services Investments(2) Total
In millions
2013
Net revenue .................. $31,124 $23,643 $27,303 $23,041 $3,593 $3,570 $ 24 $112,298
Intersegment net revenue and other .... 947 211 880 479 320 59 — 2,896
Total segment net revenue ......... $32,071 $23,854 $28,183 $23,520 $3,913 $3,629 $ 24 $115,194
Earnings (loss) from operations ...... $ 949 $3,890 $ 4,301 $ 679 $ 866 $ 399 $ (236) $ 10,848
2012
Net revenue .................. $34,774 $24,266 $28,628 $25,091 $3,757 $3,784 $ 57 $120,357
Intersegment net revenue and other .... 951 221 1,151 518 303 35 1 3,180
Total segment net revenue ......... $35,725 $24,487 $29,779 $25,609 $4,060 $3,819 $ 58 $123,537
Earnings (loss) from operations ...... $1,689 $ 3,585 $ 5,194 $ 1,045 $ 827 $ 388 $ (233) $ 12,495
2011
Net revenue .................. $38,448 $25,874 $30,135 $25,938 $3,128 $3,568 $ 154 $127,245
Intersegment net revenue and other .... 1,206 302 1,325 330 239 28 12 3,442
Total segment net revenue ......... $39,654 $26,176 $31,460 $26,268 $3,367 $3,596 $ 166 $130,687
Earnings (loss) from operations ...... $2,327 $ 3,927 $ 6,265 $ 1,972 $ 722 $ 348 $(1,633) $ 13,928
(1) Includes the results of Autonomy from the date of acquisition in October 2011.
(2) Includes the impact of the decision to wind down the webOS device business during the quarter ended October 31, 2011.
161