HP 2013 Annual Report Download - page 61
Download and view the complete annual report
Please find page 61 of the 2013 HP annual report below. You can navigate through the pages in the report by either clicking on the pages listed below, or by using the keyword search tool below to find specific information within the annual report.-
 1
1 -
2
-
3
-
4
-
5
-
6
-
7
-
8
-
9
-
10
-
11
-
12
-
13
-
14
-
15
-
16
-
17
-
18
-
19
-
20
-
21
-
22
-
23
-
24
-
25
-
26
-
27
-
28
-
29
-
30
-
31
-
32
-
33
-
34
-
35
-
36
-
37
-
38
-
39
-
40
-
41
-
42
-
43
-
44
-
45
-
46
-
47
-
48
-
49
-
50
-
 51
51 -
 52
52 -
 53
53 -
 54
54 -
 55
55 -
 56
56 -
 57
57 -
 58
58 -
 59
59 -
 60
60 -
 61
61 -
 62
62 -
 63
63 -
 64
64 -
 65
65 -
 66
66 -
 67
67 -
 68
68 -
 69
69 -
 70
70 -
 71
71 -
72
-
73
-
74
-
75
-
76
-
77
-
78
-
79
-
80
-
81
-
82
-
83
-
84
-
85
-
86
-
87
-
88
-
89
-
90
-
91
-
92
-
93
-
94
-
95
-
96
-
97
-
98
-
99
-
100
-
101
-
102
-
103
-
104
-
105
-
106
-
107
-
108
-
109
-
110
-
111
-
112
-
113
-
114
-
115
-
116
-
117
-
118
-
119
-
120
-
121
-
122
-
123
-
124
-
125
-
126
-
127
-
128
-
129
-
130
-
131
-
132
-
133
-
134
-
135
-
136
-
137
-
138
-
139
-
140
-
141
-
142
-
143
-
144
-
145
-
146
-
147
-
148
-
149
-
150
-
151
-
152
-
153
-
154
-
155
-
156
-
157
-
158
-
159
-
160
-
161
-
162
-
163
-
164
-
165
-
166
-
167
-
168
-
169
-
170
-
171
-
172
-
173
-
174
-
175
-
176
-
177
-
178
-
179
-
180
-
181
-
182
-
183
-
184
-
185
-
186
-
187
-
188
-
189
-
190
-
191
-
192
-
193
-
194
-
195
-
196
-
197
-
198
-
199
-
200
-
201
-
202
-
203
-
204
 |
 |

HEWLETT-PACKARD COMPANY AND SUBSIDIARIES
Management’s Discussion and Analysis of
Financial Condition and Results of Operations (Continued)
operational results and trends. This constant currency disclosure is provided in addition to, and not as a
substitute for, the year-over-year percentage change in revenue on a GAAP basis. Other companies
may calculate and define similarly labled items differently, which may limit the usefulness of this
measure for comparative purposes.
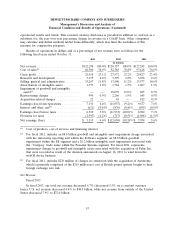
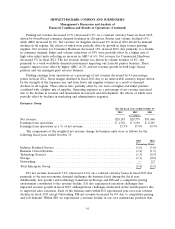
Results of operations in dollars and as a percentage of net revenue were as follows for the
following fiscal years ended October 31:
2013 2012 2011
In millions
Net revenue ......................... $112,298 100.0% $120,357 100.0% $127,245 100.0%
Cost of sales(1) ....................... 86,380 76.9% 92,385 76.8% 97,418 76.6%
Gross profit ......................... 25,918 23.1% 27,972 23.2% 29,827 23.4%
Research and development .............. 3,135 2.8% 3,399 2.8% 3,254 2.6%
Selling, general and administrative ......... 13,267 11.8% 13,500 11.2% 13,577 10.6%
Amortization of intangible assets .......... 1,373 1.2% 1,784 1.5% 1,607 1.3%
Impairment of goodwill and intangible
assets(2) ........................... — — 18,035 15.0% 885 0.7%
Restructuring charges .................. 990 0.9% 2,266 1.9% 645 0.5%
Acquisition-related charges .............. 22 — 45 — 182 0.1%
Earnings (loss) from operations ........... 7,131 6.4% (11,057) (9.2)% 9,677 7.6%
Interest and other, net(3) ................ (621) (0.6)% (876) (0.8)% (695) (0.5)%
Earnings (loss) before taxes .............. 6,510 5.8% (11,933) (10.0)% 8,982 7.1%
Provision for taxes .................... (1,397) (1.2)% (717) (0.5)% (1,908) (1.5)%
Net earnings (loss) .................... $ 5,113 4.6% $ (12,650) (10.5)% $ 7,074 5.6%
(1) Cost of products, cost of services and financing interest.
(2) For fiscal 2012, includes an $8.8 billion goodwill and intangible asset impairment charge associated
with the Autonomy reporting unit within the Software segment, an $8.0 billion goodwill
impairment within the ES segment and a $1.2 billion intangible asset impairment associated with
the ‘‘Compaq’’ trade name within the Personal Systems segment. For fiscal 2011, represents
impairment charges to goodwill and intangible assets associated with the acquisition of Palm, Inc.
that were recorded as result of the decision announced on August 18, 2011 to wind down the
webOS device business.
(3) For fiscal 2011, includes $276 million of charges in connection with the acquisition of Autonomy,
which is primarily comprised of the $265 million net cost of British pound options bought to limit
foreign exchange rate risk.
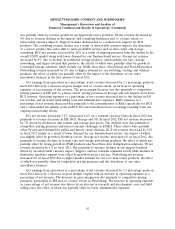
Net Revenue
Fiscal 2013
In fiscal 2013, our total net revenue decreased 6.7% (decreased 5.5% on a constant currency
basis). U.S. net revenue decreased 4.4% to $40.3 billion, while net revenue from outside of the United
States decreased 7.9% to $72.0 billion.
53