HP 2013 Annual Report Download - page 110
Download and view the complete annual report
Please find page 110 of the 2013 HP annual report below. You can navigate through the pages in the report by either clicking on the pages listed below, or by using the keyword search tool below to find specific information within the annual report.-
 1
1 -
2
-
3
-
4
-
5
-
6
-
7
-
8
-
9
-
10
-
11
-
12
-
13
-
14
-
15
-
16
-
17
-
18
-
19
-
20
-
21
-
22
-
23
-
24
-
25
-
26
-
27
-
28
-
29
-
30
-
31
-
32
-
33
-
34
-
35
-
36
-
37
-
38
-
39
-
40
-
41
-
42
-
43
-
44
-
45
-
46
-
47
-
48
-
49
-
50
-
51
-
52
-
53
-
54
-
55
-
56
-
57
-
58
-
59
-
60
-
61
-
62
-
63
-
64
-
65
-
66
-
67
-
68
-
69
-
70
-
71
-
72
-
73
-
74
-
75
-
76
-
77
-
78
-
79
-
80
-
81
-
82
-
83
-
84
-
85
-
86
-
87
-
88
-
89
-
90
-
91
-
92
-
93
-
94
-
95
-
96
-
97
-
98
-
99
-
 100
100 -
 101
101 -
 102
102 -
 103
103 -
 104
104 -
 105
105 -
 106
106 -
 107
107 -
 108
108 -
 109
109 -
 110
110 -
 111
111 -
 112
112 -
 113
113 -
 114
114 -
 115
115 -
 116
116 -
 117
117 -
 118
118 -
 119
119 -
 120
120 -
121
-
122
-
123
-
124
-
125
-
126
-
127
-
128
-
129
-
130
-
131
-
132
-
133
-
134
-
135
-
136
-
137
-
138
-
139
-
140
-
141
-
142
-
143
-
144
-
145
-
146
-
147
-
148
-
149
-
150
-
151
-
152
-
153
-
154
-
155
-
156
-
157
-
158
-
159
-
160
-
161
-
162
-
163
-
164
-
165
-
166
-
167
-
168
-
169
-
170
-
171
-
172
-
173
-
174
-
175
-
176
-
177
-
178
-
179
-
180
-
181
-
182
-
183
-
184
-
185
-
186
-
187
-
188
-
189
-
190
-
191
-
192
-
193
-
194
-
195
-
196
-
197
-
198
-
199
-
200
-
201
-
202
-
203
-
204
 |
 |

HEWLETT-PACKARD COMPANY AND SUBSIDIARIES
Notes to Consolidated Financial Statements (Continued)
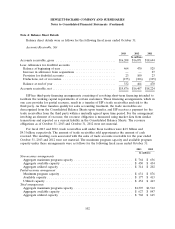
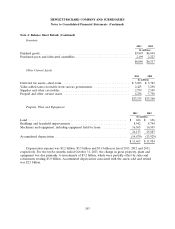
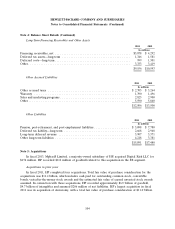
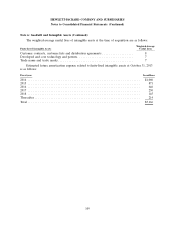
Note 4: Balance Sheet Details
Balance sheet details were as follows for the following fiscal years ended October 31:
Accounts Receivable, Net
2013 2012 2011
In millions
Accounts receivable, gross .................................. $16,208 $16,871 $18,694
Less: Allowance for doubtful accounts
Balance at beginning of year ............................... 464 470 525
Increase in allowance from acquisitions .......................——27
Provision for doubtful accounts ............................. 23 100 23
Deductions, net of recoveries ............................... (155) (106) (105)
Balance at end of year ................................... 332 464 470
Accounts receivable, net .................................... $15,876 $16,407 $18,224
HP has third-party financing arrangements consisting of revolving short-term financing intended to
facilitate the working capital requirements of certain customers. These financing arrangements, which in
one case provides for partial recourse, result in a transfer of HP’s trade receivables and risk to the
third party. As these transfers qualify for sales accounting treatment, the trade receivables are
derecognized from the Consolidated Balance Sheets upon transfer, and HP receives a payment for the
trade receivables from the third party within a mutually agreed upon time period. For the arrangement
involving an element of recourse, the recourse obligation is measured using market data from similar
transactions and reported as a current liability in the Consolidated Balance Sheets. The recourse
obligations as of October 31, 2013 and October 31, 2012 were not material.
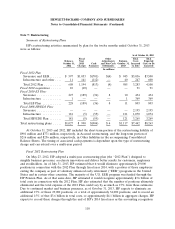
For fiscal 2013 and 2012, trade receivables sold under these facilities were $4.9 billion and
$4.3 billion, respectively. The amount of trade receivables sold approximates the amount of cash
received. The resulting costs associated with the sales of trade accounts receivable for the year ended
October 31, 2013 and 2012 were not material. The maximum program capacity and available program
capacity under these arrangements were as follows for the following fiscal years ended October 31:
2013 2012
In millions
Non-recourse arrangements
Aggregate maximum program capacity ................................. $ 764 $ 636
Aggregate available capacity ........................................ $ 450 $ 434
Aggregate utilized capacity ......................................... $ 314 $ 202
Partial-recourse arrangement
Maximum program capacity ......................................... $ 631 $ 876
Available capacity ................................................ $ 177 $ 413
Utilized capacity ................................................. $ 454 $ 463
Total arrangements
Aggregate maximum program capacity ................................. $1,395 $1,512
Aggregate available capacity ........................................ $ 627 $ 847
Aggregate utilized capacity ......................................... $ 768 $ 665
102