HP 2013 Annual Report Download - page 73
Download and view the complete annual report
Please find page 73 of the 2013 HP annual report below. You can navigate through the pages in the report by either clicking on the pages listed below, or by using the keyword search tool below to find specific information within the annual report.-
 1
1 -
2
-
3
-
4
-
5
-
6
-
7
-
8
-
9
-
10
-
11
-
12
-
13
-
14
-
15
-
16
-
17
-
18
-
19
-
20
-
21
-
22
-
23
-
24
-
25
-
26
-
27
-
28
-
29
-
30
-
31
-
32
-
33
-
34
-
35
-
36
-
37
-
38
-
39
-
40
-
41
-
42
-
43
-
44
-
45
-
46
-
47
-
48
-
49
-
50
-
51
-
52
-
53
-
54
-
55
-
56
-
57
-
58
-
59
-
60
-
61
-
62
-
 63
63 -
 64
64 -
 65
65 -
 66
66 -
 67
67 -
 68
68 -
 69
69 -
 70
70 -
 71
71 -
 72
72 -
 73
73 -
 74
74 -
 75
75 -
 76
76 -
 77
77 -
 78
78 -
 79
79 -
 80
80 -
 81
81 -
 82
82 -
 83
83 -
84
-
85
-
86
-
87
-
88
-
89
-
90
-
91
-
92
-
93
-
94
-
95
-
96
-
97
-
98
-
99
-
100
-
101
-
102
-
103
-
104
-
105
-
106
-
107
-
108
-
109
-
110
-
111
-
112
-
113
-
114
-
115
-
116
-
117
-
118
-
119
-
120
-
121
-
122
-
123
-
124
-
125
-
126
-
127
-
128
-
129
-
130
-
131
-
132
-
133
-
134
-
135
-
136
-
137
-
138
-
139
-
140
-
141
-
142
-
143
-
144
-
145
-
146
-
147
-
148
-
149
-
150
-
151
-
152
-
153
-
154
-
155
-
156
-
157
-
158
-
159
-
160
-
161
-
162
-
163
-
164
-
165
-
166
-
167
-
168
-
169
-
170
-
171
-
172
-
173
-
174
-
175
-
176
-
177
-
178
-
179
-
180
-
181
-
182
-
183
-
184
-
185
-
186
-
187
-
188
-
189
-
190
-
191
-
192
-
193
-
194
-
195
-
196
-
197
-
198
-
199
-
200
-
201
-
202
-
203
-
204
 |
 |

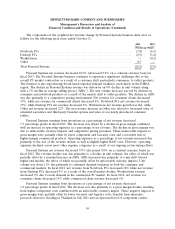
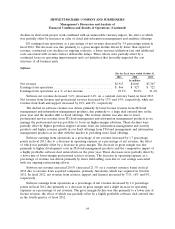
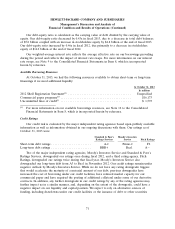
HEWLETT-PACKARD COMPANY AND SUBSIDIARIES
Management’s Discussion and Analysis of
Financial Condition and Results of Operations (Continued)
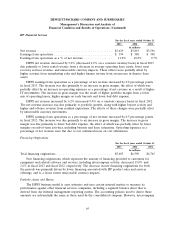
HP Financial Services
For the fiscal years ended October 31
2013 2012 2011
In millions
Net revenue .......................................... $3,629 $3,819 $3,596
Earnings from operations ................................. $ 399 $ 388 $ 348
Earnings from operations as a % of net revenue ................ 11.0% 10.2% 9.7%
HPFS net revenue decreased by 5.0% (decreased 4.2% on a constant currency basis) in fiscal 2013
due primarily to lower rental revenue from a decrease in average operating lease assets, lower asset
recovery services revenue, and unfavorable currency impacts. These effects were partially offset by
higher revenue from remarketing sales and higher finance income from an increase in finance lease
assets.
HPFS earnings from operations as a percentage of net revenue increased by 0.8 percentage points
in fiscal 2013. The increase was due primarily to an increase in gross margin, the effect of which was
partially offset by an increase in operating expenses as a percentage of net revenue as a result of higher
IT investments. The increase in gross margin was the result of higher portfolio margin from a lower
mix of operating leases, higher margin on early buyouts and lower bad debt expense.
HPFS net revenue increased by 6.2% (increased 9.0% on a constant currency basis) in fiscal 2012.
The net revenue increase was due primarily to portfolio growth, along with higher buyout activity and
higher end-of-lease revenue from residual expirations. The effects of these changes were partially offset
by unfavorable currency movements.
HPFS earnings from operations as a percentage of net revenue increased by 0.5 percentage points
in fiscal 2012. The increase was due primarily to an increase in gross margin. The increase in gross
margin was due primarily to lower bad debt expense, the effect of which was partially offset by lower
margins on end-of-term activities, including buyouts and lease extensions. Operating expenses as a
percentage of net revenue were flat due to our continued focus on cost efficiencies.
Financing Originations
For the fiscal years ended October 31
2013 2012 2011
In millions
Total financing originations ................................ $5,603 $6,590 $6,765
New financing originations, which represent the amount of financing provided to customers for
equipment and related software and services, including intercompany activity, decreased 15.0% and
2.6% in fiscal 2013 and fiscal 2012, respectively. The decrease in new financing originations for both
the periods was primarily driven by lower financing associated with HP product sales and services
offerings, and to a lesser extent unfavorable currency impacts.
Portfolio Assets and Ratios
The HPFS business model is asset intensive and uses certain internal metrics to measure its
performance against other financial services companies, including a segment balance sheet that is
derived from our internal management reporting system. The accounting policies used to derive these
amounts are substantially the same as those used by the consolidated company. However, intercompany
65