HP 2013 Annual Report Download - page 62
Download and view the complete annual report
Please find page 62 of the 2013 HP annual report below. You can navigate through the pages in the report by either clicking on the pages listed below, or by using the keyword search tool below to find specific information within the annual report.-
 1
1 -
2
-
3
-
4
-
5
-
6
-
7
-
8
-
9
-
10
-
11
-
12
-
13
-
14
-
15
-
16
-
17
-
18
-
19
-
20
-
21
-
22
-
23
-
24
-
25
-
26
-
27
-
28
-
29
-
30
-
31
-
32
-
33
-
34
-
35
-
36
-
37
-
38
-
39
-
40
-
41
-
42
-
43
-
44
-
45
-
46
-
47
-
48
-
49
-
50
-
51
-
 52
52 -
 53
53 -
 54
54 -
 55
55 -
 56
56 -
 57
57 -
 58
58 -
 59
59 -
 60
60 -
 61
61 -
 62
62 -
 63
63 -
 64
64 -
 65
65 -
 66
66 -
 67
67 -
 68
68 -
 69
69 -
 70
70 -
 71
71 -
 72
72 -
73
-
74
-
75
-
76
-
77
-
78
-
79
-
80
-
81
-
82
-
83
-
84
-
85
-
86
-
87
-
88
-
89
-
90
-
91
-
92
-
93
-
94
-
95
-
96
-
97
-
98
-
99
-
100
-
101
-
102
-
103
-
104
-
105
-
106
-
107
-
108
-
109
-
110
-
111
-
112
-
113
-
114
-
115
-
116
-
117
-
118
-
119
-
120
-
121
-
122
-
123
-
124
-
125
-
126
-
127
-
128
-
129
-
130
-
131
-
132
-
133
-
134
-
135
-
136
-
137
-
138
-
139
-
140
-
141
-
142
-
143
-
144
-
145
-
146
-
147
-
148
-
149
-
150
-
151
-
152
-
153
-
154
-
155
-
156
-
157
-
158
-
159
-
160
-
161
-
162
-
163
-
164
-
165
-
166
-
167
-
168
-
169
-
170
-
171
-
172
-
173
-
174
-
175
-
176
-
177
-
178
-
179
-
180
-
181
-
182
-
183
-
184
-
185
-
186
-
187
-
188
-
189
-
190
-
191
-
192
-
193
-
194
-
195
-
196
-
197
-
198
-
199
-
200
-
201
-
202
-
203
-
204
 |
 |

HEWLETT-PACKARD COMPANY AND SUBSIDIARIES
Management’s Discussion and Analysis of
Financial Condition and Results of Operations (Continued)
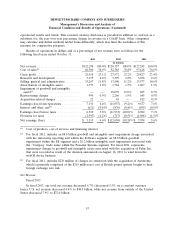
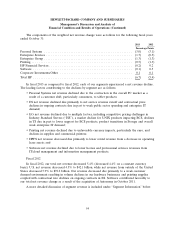
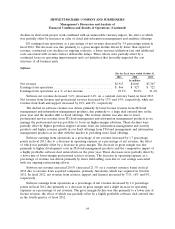
The components of the weighted net revenue change were as follows for the following fiscal years
ended October 31:
2013 2012
Percentage Points
Personal Systems .................................................. (3.0) (3.1)
Enterprise Services ................................................. (1.7) (0.5)
Enterprise Group .................................................. (1.3) (1.3)
Printing ......................................................... (0.5) (1.3)
HP Financial Services ............................................... (0.2) 0.2
Software ........................................................ (0.1) 0.5
Corporate Investments/Other ......................................... 0.1 0.1
Total HP ........................................................ (6.7) (5.4)
In fiscal 2013 as compared to fiscal 2012, each of our segments experienced a net revenue decline.
The leading factors contributing to the declines by segment are as follows:
• Personal Systems net revenue declined due to the contraction in the overall PC market as a
result of a customer shift, particularly consumers, to tablet products;
• ES net revenue declined due primarily to net service revenue runoff and contractual price
declines in ongoing contracts due in part to weak public sector spending and enterprise IT
demand;
• EG net revenue declined due to multiple factors, including competitive pricing challenges in
Industry Standard Servers (‘‘ISS’’), a market decline for UNIX products impacting BCS, declines
in TS due in part to lower support for BCS products, product transitions in Storage and overall
weak enterprise IT demand;
• Printing net revenue declined due to unfavorable currency impacts, particularly the euro, and
declines in supplies and commercial printers;
• HPFS net revenue decreased due primarily to lower rental revenue from a decrease in operating
lease assets; and
• Software net revenue declined due to lower license and professional services revenues from
IT/cloud management and information management products.
Fiscal 2012
In fiscal 2012, our total net revenue decreased 5.4% (decreased 4.4% on a constant currency
basis). U.S. net revenue decreased 4.5% to $42.1 billion, while net revenue from outside of the United
States decreased 5.9% to $78.2 billion. Our revenue decreased due primarily to a weak customer
demand environment resulting in volume declines in our hardware businesses and printing supplies
coupled with contractual rate declines on ongoing contracts in ES. Software contributed favorably to
our total net revenue change as a result of the acquisition of Autonomy in October 2011.
A more detailed discussion of segment revenue is included under ‘‘Segment Information’’ below.
54