HP 2013 Annual Report Download - page 153
Download and view the complete annual report
Please find page 153 of the 2013 HP annual report below. You can navigate through the pages in the report by either clicking on the pages listed below, or by using the keyword search tool below to find specific information within the annual report.-
 1
1 -
2
-
3
-
4
-
5
-
6
-
7
-
8
-
9
-
10
-
11
-
12
-
13
-
14
-
15
-
16
-
17
-
18
-
19
-
20
-
21
-
22
-
23
-
24
-
25
-
26
-
27
-
28
-
29
-
30
-
31
-
32
-
33
-
34
-
35
-
36
-
37
-
38
-
39
-
40
-
41
-
42
-
43
-
44
-
45
-
46
-
47
-
48
-
49
-
50
-
51
-
52
-
53
-
54
-
55
-
56
-
57
-
58
-
59
-
60
-
61
-
62
-
63
-
64
-
65
-
66
-
67
-
68
-
69
-
70
-
71
-
72
-
73
-
74
-
75
-
76
-
77
-
78
-
79
-
80
-
81
-
82
-
83
-
84
-
85
-
86
-
87
-
88
-
89
-
90
-
91
-
92
-
93
-
94
-
95
-
96
-
97
-
98
-
99
-
100
-
101
-
102
-
103
-
104
-
105
-
106
-
107
-
108
-
109
-
110
-
111
-
112
-
113
-
114
-
115
-
116
-
117
-
118
-
119
-
120
-
121
-
122
-
123
-
124
-
125
-
126
-
127
-
128
-
129
-
130
-
131
-
132
-
133
-
134
-
135
-
136
-
137
-
138
-
139
-
140
-
141
-
142
-
 143
143 -
 144
144 -
 145
145 -
 146
146 -
 147
147 -
 148
148 -
 149
149 -
 150
150 -
 151
151 -
 152
152 -
 153
153 -
 154
154 -
 155
155 -
 156
156 -
 157
157 -
 158
158 -
 159
159 -
 160
160 -
 161
161 -
 162
162 -
 163
163 -
164
-
165
-
166
-
167
-
168
-
169
-
170
-
171
-
172
-
173
-
174
-
175
-
176
-
177
-
178
-
179
-
180
-
181
-
182
-
183
-
184
-
185
-
186
-
187
-
188
-
189
-
190
-
191
-
192
-
193
-
194
-
195
-
196
-
197
-
198
-
199
-
200
-
201
-
202
-
203
-
204
 |
 |

HEWLETT-PACKARD COMPANY AND SUBSIDIARIES
Notes to Consolidated Financial Statements (Continued)
Note 15: Retirement and Post-Retirement Benefit Plans (Continued)
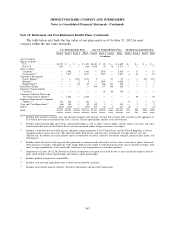
Plan Asset Allocations
The weighted-average target and actual asset allocations across the benefit plans at the respective
measurement dates were as follows:
U. S. Defined Non-U.S. Defined Post-Retirement
Benefit Plans Benefit Plans Benefit Plans
2013 2013 2013
Plan Assets Plan Assets Plan Assets
Target Target Target
Asset Category Allocation 2013 2012 Allocation 2013 2012 Allocation 2013 2012
Public equity securities ...... 37.2% 23.7% 48.0% 41.5% 9.5% 8.6%
Private/other equity securities . 12.6% 11.9% 7.9% 11.7% 59.2% 59.6%
Real estate and other ....... (0.5)% (3.3)% 7.5% 10.2% (0.1)% (0.9)%
Equity related investments . . . 55.0% 49.3% 32.3% 64.0% 63.4% 63.4% 68.0% 68.6% 67.3%
Debt securities ........... 45.0% 48.2% 61.5% 35.2% 32.5% 33.4% 28.0% 29.0% 27.9%
Cash .................. — 2.5% 6.2% 0.8% 4.1% 3.2% 4.0% 2.4% 4.8%
Total ................. 100.0% 100.0% 100.0% 100.0% 100.0% 100.0% 100.0% 100.0% 100.0%
Investment Policy
HP’s investment strategy is to seek a competitive rate of return relative to an appropriate level of
risk depending on the funded status of each plan. The majority of the plans’ investment managers
employ active investment management strategies with the goal of outperforming the broad markets in
which they invest. Risk management practices include diversification across asset classes and investment
styles and periodic rebalancing toward asset allocation targets. A number of the plans’ investment
managers are authorized to utilize derivatives for investment or liability exposures, and HP may utilize
derivatives to effect asset allocation changes or to hedge certain investment or liability exposures.
The target asset allocation selected for each U.S. plan reflects a risk/return profile HP believes is
appropriate relative to each plan’s liability structure and return goals. HP conducts periodic asset-
liability studies for U.S. plans in order to model various potential asset allocations in comparison to
each plan’s forecasted liabilities and liquidity needs. HP invests a portion of the U.S. defined benefit
plan assets and post-retirement benefit plan assets in private market securities such as private equity
funds to provide diversification and a higher expected return on assets.
Outside the United States, asset allocation decisions are typically made by an independent board
of trustees for the specific plan. As in the U.S., investment objectives are designed to generate returns
that will enable the plan to meet its future obligations. In some countries, local regulations may restrict
asset allocations, typically leading to a higher percentage of investment in fixed income securities than
would otherwise be deployed. HP reviews the investment strategy and provides a recommended list of
investment managers for each country plan, with final decisions on asset allocation and investment
managers made by the board of trustees for the specific plan.
Basis for Expected Long-Term Rate of Return on Plan Assets
The expected long-term rate of return on plan assets reflects the expected returns for each major
asset class in which the plan invests and the weight of each asset class in the target mix. Expected asset
returns reflect the current yield on government bonds, risk premiums for each asset class, and expected
145