HP 2013 Annual Report Download - page 154
Download and view the complete annual report
Please find page 154 of the 2013 HP annual report below. You can navigate through the pages in the report by either clicking on the pages listed below, or by using the keyword search tool below to find specific information within the annual report.-
 1
1 -
2
-
3
-
4
-
5
-
6
-
7
-
8
-
9
-
10
-
11
-
12
-
13
-
14
-
15
-
16
-
17
-
18
-
19
-
20
-
21
-
22
-
23
-
24
-
25
-
26
-
27
-
28
-
29
-
30
-
31
-
32
-
33
-
34
-
35
-
36
-
37
-
38
-
39
-
40
-
41
-
42
-
43
-
44
-
45
-
46
-
47
-
48
-
49
-
50
-
51
-
52
-
53
-
54
-
55
-
56
-
57
-
58
-
59
-
60
-
61
-
62
-
63
-
64
-
65
-
66
-
67
-
68
-
69
-
70
-
71
-
72
-
73
-
74
-
75
-
76
-
77
-
78
-
79
-
80
-
81
-
82
-
83
-
84
-
85
-
86
-
87
-
88
-
89
-
90
-
91
-
92
-
93
-
94
-
95
-
96
-
97
-
98
-
99
-
100
-
101
-
102
-
103
-
104
-
105
-
106
-
107
-
108
-
109
-
110
-
111
-
112
-
113
-
114
-
115
-
116
-
117
-
118
-
119
-
120
-
121
-
122
-
123
-
124
-
125
-
126
-
127
-
128
-
129
-
130
-
131
-
132
-
133
-
134
-
135
-
136
-
137
-
138
-
139
-
140
-
141
-
142
-
143
-
 144
144 -
 145
145 -
 146
146 -
 147
147 -
 148
148 -
 149
149 -
 150
150 -
 151
151 -
 152
152 -
 153
153 -
 154
154 -
 155
155 -
 156
156 -
 157
157 -
 158
158 -
 159
159 -
 160
160 -
 161
161 -
 162
162 -
 163
163 -
 164
164 -
165
-
166
-
167
-
168
-
169
-
170
-
171
-
172
-
173
-
174
-
175
-
176
-
177
-
178
-
179
-
180
-
181
-
182
-
183
-
184
-
185
-
186
-
187
-
188
-
189
-
190
-
191
-
192
-
193
-
194
-
195
-
196
-
197
-
198
-
199
-
200
-
201
-
202
-
203
-
204
 |
 |

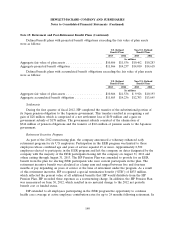
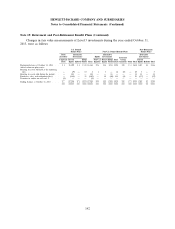
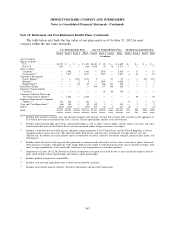
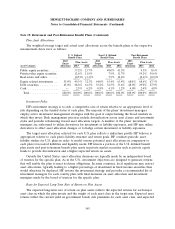
HEWLETT-PACKARD COMPANY AND SUBSIDIARIES
Notes to Consolidated Financial Statements (Continued)
Note 15: Retirement and Post-Retirement Benefit Plans (Continued)
real returns which considers each country’s specific inflation outlook. Because HP’s investment policy is
to employ primarily active investment managers who seek to outperform the broader market, the
expected returns are adjusted to reflect the expected additional returns net of fees.
Future Contributions and Funding Policy
In fiscal 2014, HP expects to contribute approximately $617 million to its non-U.S. pension plans
and approximately $33 million to cover benefit payments to U.S. non-qualified plan participants. HP
expects to pay approximately $109 million to cover benefit claims for HP’s post-retirement benefit
plans. HP’s funding policy is to fund its pension plans so that it meets at least the minimum
contribution requirements, as established by local government, funding and taxing authorities.
Estimated Future Benefits Payable
HP estimates that the future benefits payable for the retirement and post-retirement plans were as
follows at October 31, 2013:
Non-U.S.
U.S. Defined Defined Post-Retirement
Benefit Plans Benefit Plans Benefit Plans
In millions
Fiscal year ending October 31
2014 ........................................ $ 694 $ 549 $146
2015 ........................................ $ 553 $ 538 $ 76
(1)
2016 ........................................ $ 573 $ 546 $ 70
2017 ........................................ $ 610 $ 596 $ 67
2018 ........................................ $ 653 $ 636 $ 65
Next five fiscal years to October 31, 2023 ............... $3,681 $3,960 $286
(1) Decrease in future benefits payable due to the winding down of the 2012 EER program.
Note 16: Commitments
Lease Commitments
HP leases certain real and personal property under non-cancelable operating leases. Certain leases
require HP to pay property taxes, insurance and routine maintenance and include renewal options and
escalation clauses. Rent expense was $1.0 billion in fiscal 2013, 2012 and 2011. Sublease rental income
was $30 million in fiscal 2013, $37 million in fiscal 2012 and $38 million in fiscal 2011.
Property under capital lease comprised primarily of equipment and furniture, which was
$437 million and $482 million as of October 31, 2013 and October 31, 2012, respectively, and was
included in property, plant and equipment in the Consolidated Balance Sheets. Accumulated
depreciation on the property under capital lease was $404 million and $418 million as of October 31,
2013 and October 31, 2012, respectively. The related depreciation is included in depreciation expense.
146