HP 2013 Annual Report Download - page 63
Download and view the complete annual report
Please find page 63 of the 2013 HP annual report below. You can navigate through the pages in the report by either clicking on the pages listed below, or by using the keyword search tool below to find specific information within the annual report.-
 1
1 -
2
-
3
-
4
-
5
-
6
-
7
-
8
-
9
-
10
-
11
-
12
-
13
-
14
-
15
-
16
-
17
-
18
-
19
-
20
-
21
-
22
-
23
-
24
-
25
-
26
-
27
-
28
-
29
-
30
-
31
-
32
-
33
-
34
-
35
-
36
-
37
-
38
-
39
-
40
-
41
-
42
-
43
-
44
-
45
-
46
-
47
-
48
-
49
-
50
-
51
-
52
-
 53
53 -
 54
54 -
 55
55 -
 56
56 -
 57
57 -
 58
58 -
 59
59 -
 60
60 -
 61
61 -
 62
62 -
 63
63 -
 64
64 -
 65
65 -
 66
66 -
 67
67 -
 68
68 -
 69
69 -
 70
70 -
 71
71 -
 72
72 -
 73
73 -
74
-
75
-
76
-
77
-
78
-
79
-
80
-
81
-
82
-
83
-
84
-
85
-
86
-
87
-
88
-
89
-
90
-
91
-
92
-
93
-
94
-
95
-
96
-
97
-
98
-
99
-
100
-
101
-
102
-
103
-
104
-
105
-
106
-
107
-
108
-
109
-
110
-
111
-
112
-
113
-
114
-
115
-
116
-
117
-
118
-
119
-
120
-
121
-
122
-
123
-
124
-
125
-
126
-
127
-
128
-
129
-
130
-
131
-
132
-
133
-
134
-
135
-
136
-
137
-
138
-
139
-
140
-
141
-
142
-
143
-
144
-
145
-
146
-
147
-
148
-
149
-
150
-
151
-
152
-
153
-
154
-
155
-
156
-
157
-
158
-
159
-
160
-
161
-
162
-
163
-
164
-
165
-
166
-
167
-
168
-
169
-
170
-
171
-
172
-
173
-
174
-
175
-
176
-
177
-
178
-
179
-
180
-
181
-
182
-
183
-
184
-
185
-
186
-
187
-
188
-
189
-
190
-
191
-
192
-
193
-
194
-
195
-
196
-
197
-
198
-
199
-
200
-
201
-
202
-
203
-
204
 |
 |

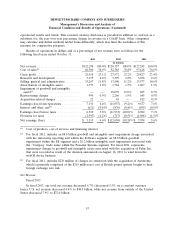
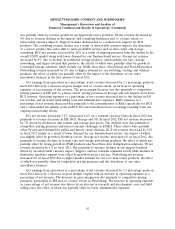
HEWLETT-PACKARD COMPANY AND SUBSIDIARIES
Management’s Discussion and Analysis of
Financial Condition and Results of Operations (Continued)
Gross Margin
Our total gross margin decreased 0.1 percentage points and 0.2 percentage points in fiscal 2013
and 2012, respectively.
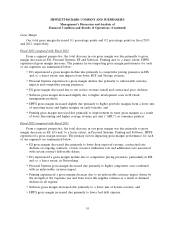
Fiscal 2013 compared with Fiscal 2012
From a segment perspective, the total decrease in our gross margin was due primarily to gross
margin decreases in EG, Personal Systems, ES and Software. Printing and, to a lesser extent, HPFS
experienced gross margin increases. The primary factors impacting gross margin performance for each
of our segments are summarized below:
• EG experienced a gross margin decline due primarily to competitive pricing pressures in ISS
and, to a lesser extent, mix impacts from lower BCS and Storage revenue;
• Personal Systems experienced a gross margin decline due primarily to unfavorable currency
impacts and competitive pricing pressures;
• ES gross margin decreased due to net service revenue runoff and contractual price declines;
• Software gross margin decreased slightly due to higher development costs in IT/cloud
management products;
• HPFS gross margin increased slightly due primarily to higher portfolio margins from a lower mix
of operating leases and higher margins on early buyouts; and
• Printing gross margin increased due primarily to improvement in toner gross margins as a result
of lower discounting and higher average revenue per unit (‘‘ARU’’) in consumer printers.
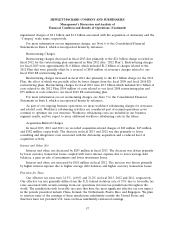
Fiscal 2012 compared with Fiscal 2011
From a segment perspective, the total decrease in our gross margin was due primarily to gross
margin decreases in ES, EG and, to a lesser extent, in Personal Systems, Printing and Software. HPFS
experienced a gross margin increase. The primary factors impacting gross margin performance for each
of our segments are summarized below:
• ES gross margin decreased due primarily to lower than expected revenue, contractual rate
declines on ongoing contracts, a lower resource utilization rate and additional costs associated
with certain contract deliverable delays;
• EG experienced a gross margin decline due to competitive pricing pressures, particularly in ISS
and, to a lesser extent, in Networking;
• Personal Systems gross margin decreased due primarily to higher component costs combined
with an unfavorable currency impact;
• Printing experienced a gross margin decrease due to an unfavorable currency impact driven by
the strength of the Japanese yen and from lower ink supplies volumes as a result of demand
declines in all regions;
• Software gross margin decreased due primarily to a lower mix of license revenue; and
• HPFS gross margin increased due primarily to lower bad debt expense.
55