HP 2013 Annual Report Download - page 78
Download and view the complete annual report
Please find page 78 of the 2013 HP annual report below. You can navigate through the pages in the report by either clicking on the pages listed below, or by using the keyword search tool below to find specific information within the annual report.-
 1
1 -
2
-
3
-
4
-
5
-
6
-
7
-
8
-
9
-
10
-
11
-
12
-
13
-
14
-
15
-
16
-
17
-
18
-
19
-
20
-
21
-
22
-
23
-
24
-
25
-
26
-
27
-
28
-
29
-
30
-
31
-
32
-
33
-
34
-
35
-
36
-
37
-
38
-
39
-
40
-
41
-
42
-
43
-
44
-
45
-
46
-
47
-
48
-
49
-
50
-
51
-
52
-
53
-
54
-
55
-
56
-
57
-
58
-
59
-
60
-
61
-
62
-
63
-
64
-
65
-
66
-
67
-
 68
68 -
 69
69 -
 70
70 -
 71
71 -
 72
72 -
 73
73 -
 74
74 -
 75
75 -
 76
76 -
 77
77 -
 78
78 -
 79
79 -
 80
80 -
 81
81 -
 82
82 -
 83
83 -
 84
84 -
 85
85 -
 86
86 -
 87
87 -
 88
88 -
89
-
90
-
91
-
92
-
93
-
94
-
95
-
96
-
97
-
98
-
99
-
100
-
101
-
102
-
103
-
104
-
105
-
106
-
107
-
108
-
109
-
110
-
111
-
112
-
113
-
114
-
115
-
116
-
117
-
118
-
119
-
120
-
121
-
122
-
123
-
124
-
125
-
126
-
127
-
128
-
129
-
130
-
131
-
132
-
133
-
134
-
135
-
136
-
137
-
138
-
139
-
140
-
141
-
142
-
143
-
144
-
145
-
146
-
147
-
148
-
149
-
150
-
151
-
152
-
153
-
154
-
155
-
156
-
157
-
158
-
159
-
160
-
161
-
162
-
163
-
164
-
165
-
166
-
167
-
168
-
169
-
170
-
171
-
172
-
173
-
174
-
175
-
176
-
177
-
178
-
179
-
180
-
181
-
182
-
183
-
184
-
185
-
186
-
187
-
188
-
189
-
190
-
191
-
192
-
193
-
194
-
195
-
196
-
197
-
198
-
199
-
200
-
201
-
202
-
203
-
204
 |
 |

HEWLETT-PACKARD COMPANY AND SUBSIDIARIES
Management’s Discussion and Analysis of
Financial Condition and Results of Operations (Continued)
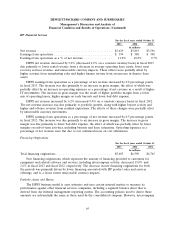
DSO were partially offset by revenue linearity. The decrease in DOS was due to lower inventory
balances in most segments as of October 31, 2012. The increase in DPO was primarily due to improved
purchasing linearity.
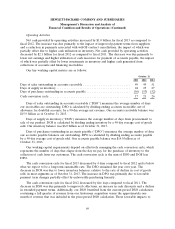
Investing Activities
Net cash used in investing activities decreased by $0.7 billion for fiscal 2013 as compared to fiscal
2012, due primarily to lower investments in property, plant and equipment and higher net sales and
maturities of available-for-sale securities. Net cash used in investing activities decreased by $10.5 billion
for fiscal 2012 as compared to fiscal 2011, due primarily to lower payments for acquisitions in 2012.
Financing Activities
Net cash used in financing activities increased by $4.1 billion for fiscal 2013 as compared to fiscal
2012. The increase was due primarily to higher maturities of debt and net repayments of commercial
paper. Net cash used in financing activities increased by approximately $2.3 billion for fiscal 2012 as
compared to fiscal 2011. The increase was due primarily to lower net proceeds from the issuance of
U.S. Dollar Global Notes and an increase in net repayment of commercial paper, the impact of which
was partially offset by lower cash paid for repurchases of our common stock.
For more information on our share repurchase programs, see Item 5 and Note 14 to the
Consolidated Financial Statements in Item 8, which are incorporated herein by reference.
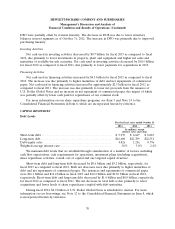
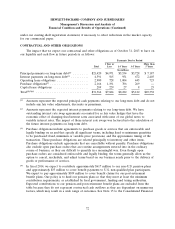
CAPITAL RESOURCES
Debt Levels
For the fiscal years ended October 31
2013 2012 2011
In millions, except
interest rates and ratios
Short-term debt ........................................ $ 5,979 $ 6,647 $ 8,083
Long-term debt ........................................ $16,608 $21,789 $22,551
Debt-equity ratio ....................................... 0.82x 1.25x 0.79x
Weighted-average interest rate ............................. 3.0% 3.0% 2.4%
We maintain debt levels that we establish through consideration of a number of factors, including
cash flow expectations, cash requirements for operations, investment plans (including acquisitions),
share repurchase activities, overall cost of capital and our targeted capital structure.
Short-term debt and long-term debt decreased by $0.6 billion and $5.2 billion, respectively, for
fiscal 2013 as compared to fiscal 2012. Both net decreases were due primarily to higher maturities of
debt and net repayments of commercial paper. The issuances and repayments of commercial paper
were $16.1 billion and $16.2 billion in fiscal 2013 and $12.2 billion and $15.0 billion in fiscal 2012,
respectively. Short-term debt and long-term debt decreased by $1.4 billion and $0.8 billion, respectively,
for fiscal 2012 as compared to fiscal 2011. The net decrease in total debt is due primarily to fewer
acquisitions and lower levels of share repurchases coupled with debt maturities.
During fiscal 2014, $4.9 billion of U.S. Dollar Global Notes is scheduled to mature. For more
information on our borrowings, see Note 12 to the Consolidated Financial Statements in Item 8, which
is incorporated herein by reference.
70