HP 2013 Annual Report Download - page 79
Download and view the complete annual report
Please find page 79 of the 2013 HP annual report below. You can navigate through the pages in the report by either clicking on the pages listed below, or by using the keyword search tool below to find specific information within the annual report.-
 1
1 -
2
-
3
-
4
-
5
-
6
-
7
-
8
-
9
-
10
-
11
-
12
-
13
-
14
-
15
-
16
-
17
-
18
-
19
-
20
-
21
-
22
-
23
-
24
-
25
-
26
-
27
-
28
-
29
-
30
-
31
-
32
-
33
-
34
-
35
-
36
-
37
-
38
-
39
-
40
-
41
-
42
-
43
-
44
-
45
-
46
-
47
-
48
-
49
-
50
-
51
-
52
-
53
-
54
-
55
-
56
-
57
-
58
-
59
-
60
-
61
-
62
-
63
-
64
-
65
-
66
-
67
-
68
-
 69
69 -
 70
70 -
 71
71 -
 72
72 -
 73
73 -
 74
74 -
 75
75 -
 76
76 -
 77
77 -
 78
78 -
 79
79 -
 80
80 -
 81
81 -
 82
82 -
 83
83 -
 84
84 -
 85
85 -
 86
86 -
 87
87 -
 88
88 -
 89
89 -
90
-
91
-
92
-
93
-
94
-
95
-
96
-
97
-
98
-
99
-
100
-
101
-
102
-
103
-
104
-
105
-
106
-
107
-
108
-
109
-
110
-
111
-
112
-
113
-
114
-
115
-
116
-
117
-
118
-
119
-
120
-
121
-
122
-
123
-
124
-
125
-
126
-
127
-
128
-
129
-
130
-
131
-
132
-
133
-
134
-
135
-
136
-
137
-
138
-
139
-
140
-
141
-
142
-
143
-
144
-
145
-
146
-
147
-
148
-
149
-
150
-
151
-
152
-
153
-
154
-
155
-
156
-
157
-
158
-
159
-
160
-
161
-
162
-
163
-
164
-
165
-
166
-
167
-
168
-
169
-
170
-
171
-
172
-
173
-
174
-
175
-
176
-
177
-
178
-
179
-
180
-
181
-
182
-
183
-
184
-
185
-
186
-
187
-
188
-
189
-
190
-
191
-
192
-
193
-
194
-
195
-
196
-
197
-
198
-
199
-
200
-
201
-
202
-
203
-
204
 |
 |

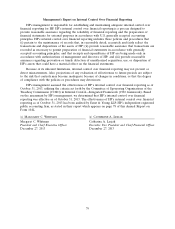
HEWLETT-PACKARD COMPANY AND SUBSIDIARIES
Management’s Discussion and Analysis of
Financial Condition and Results of Operations (Continued)
Our debt-equity ratio is calculated as the carrying value of debt divided by the carrying value of
equity. Our debt-equity ratio decreased by 0.43x in fiscal 2013, due to a decrease in total debt balances
of $5.8 billion coupled with an increase in stockholders equity by $4.8 billion at the end of fiscal 2013.
Our debt-equity ratio increased by 0.46x in fiscal 2012, due primarily to a decrease in stockholders
equity of $16.2 billion at the end of fiscal 2012.
Our weighted-average interest rate reflects the average effective rate on our borrowings prevailing
during the period and reflects the impact of interest rate swaps. For more information on our interest
rate swaps, see Note 9 to the Consolidated Financial Statements in Item 8, which is incorporated
herein by reference.
Available Borrowing Resources
At October 31, 2013, we had the following resources available to obtain short-term or long-term
financings if we need additional liquidity:
At October 31, 2013
In millions
2012 Shelf Registration Statement(1) .................................... Unspecified
Commercial paper programs(1) ........................................ $16,173
Uncommitted lines of credit(1) ........................................ $ 1,593
(1) For more information on our available borrowings resources, see Note 12 to the Consolidated
Financial Statements in Item 8, which is incorporated herein by reference.
Credit Ratings
Our credit risk is evaluated by the major independent rating agencies based upon publicly available
information as well as information obtained in our ongoing discussions with them. Our ratings as of
October 31, 2013 were:
Standard & Poor’s Moody’s Investors
Ratings Services Service Fitch Ratings
Short-term debt ratings ....................... A-2 Prime-2 F2
Long-term debt ratings ....................... BBB+ Baa1 Aǁ
Two of the major independent rating agencies, Moody’s Investors Service and Standard & Poor’s
Ratings Services, downgraded our ratings once during fiscal 2012, and a third rating agency, Fitch
Ratings, downgraded our ratings twice during that fiscal year. Moody’s Investors Service also
downgraded our long-term debt from A3 to Baa1 in November 2012. Our credit ratings remain under
negative outlook by Moody’s Investors Service. While we do not have any rating downgrade triggers
that would accelerate the maturity of a material amount of our debt, previous downgrades have
increased the cost of borrowing under our credit facilities, have reduced market capacity for our
commercial paper and have required the posting of additional collateral under some of our derivative
contracts. In addition, any further downgrade in our credit ratings by any of the rating agencies may
further impact us in a similar manner, and, depending on the extent of the downgrade, could have a
negative impact on our liquidity and capital position. We expect to rely on alternative sources of
funding, including drawdowns under our credit facilities or the issuance of debt or other securities
71