Delta Airlines 2008 Annual Report Download - page 97
Download and view the complete annual report
Please find page 97 of the 2008 Delta Airlines annual report below. You can navigate through the pages in the report by either clicking on the pages listed below, or by using the keyword search tool below to find specific information within the annual report.-
 1
1 -
2
-
3
-
4
-
5
-
6
-
7
-
8
-
9
-
10
-
11
-
12
-
13
-
14
-
15
-
16
-
17
-
18
-
19
-
20
-
21
-
22
-
23
-
24
-
25
-
26
-
27
-
28
-
29
-
30
-
31
-
32
-
33
-
34
-
35
-
36
-
37
-
38
-
39
-
40
-
41
-
42
-
43
-
44
-
45
-
46
-
47
-
48
-
49
-
50
-
51
-
52
-
53
-
54
-
55
-
56
-
57
-
58
-
59
-
60
-
61
-
62
-
63
-
64
-
65
-
66
-
67
-
68
-
69
-
70
-
71
-
72
-
73
-
74
-
75
-
76
-
77
-
78
-
79
-
80
-
81
-
82
-
83
-
84
-
85
-
86
-
 87
87 -
 88
88 -
 89
89 -
 90
90 -
 91
91 -
 92
92 -
 93
93 -
 94
94 -
 95
95 -
 96
96 -
 97
97 -
 98
98 -
 99
99 -
 100
100 -
 101
101 -
 102
102 -
 103
103 -
 104
104 -
 105
105 -
 106
106 -
 107
107 -
108
-
109
-
110
-
111
-
112
-
113
-
114
-
115
-
116
-
117
-
118
-
119
-
120
-
121
-
122
-
123
-
124
-
125
-
126
-
127
-
128
-
129
-
130
-
131
-
132
-
133
-
134
-
135
-
136
-
137
-
138
-
139
-
140
-
141
-
142
-
143
-
144
-
145
-
146
-
147
-
148
-
149
-
150
-
151
-
152
-
153
-
154
-
155
-
156
-
157
-
158
-
159
-
160
-
161
-
162
-
163
-
164
-
165
-
166
-
167
-
168
-
169
-
170
-
171
-
172
-
173
-
174
-
175
-
176
-
177
-
178
-
179
-
180
-
181
-
182
-
183
-
184
-
185
-
186
-
187
-
188
-
189
-
190
-
191
-
192
-
193
-
194
-
195
-
196
-
197
-
198
-
199
-
200
-
201
-
202
-
203
-
204
-
205
-
206
-
207
-
208
 |
 |
Table of Contents
Index to Financial Statements
NOTES TO THE CONSOLIDATED FINANCIAL STATEMENTS—(Continued)
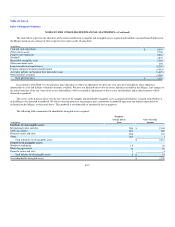
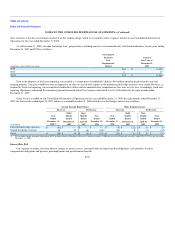
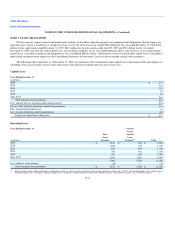
Market risk associated with our fixed and variable rate long-term debt relates to the potential reduction in fair value and negative impact to future
earnings, respectively, from an increase in interest rates. The following table presents information about our fixed and variable rate debt and the fair value of
our debt at December 31, 2008 and 2007:
(in millions)
December 31,
2008
December 31,
2007
Variable rate debt $ 9,678 $ 3,820
Fixed rate debt 8,187 4,481
Unamortized (discount) premium, net (1,859) 155
Total $ 16,006 $ 8,456
Fair value(1) $ 12,695 $ 8,148
(1) The aggregate fair value of our secured and unsecured debt was based primarily on reported market values and recently completed market transactions.
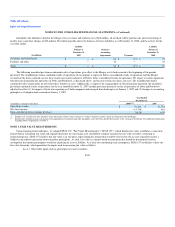
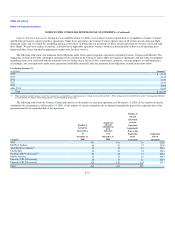
During the June 2008 quarter, we entered into interest rate swap agreements designated as fair value hedges under SFAS 133 to convert our interest rate
exposure on a portion of our debt portfolio from a fixed rate to a floating rate. The interest rate swap agreements have an aggregate notional amount of $1.0
billion and mature from September 2011 through July 2012, which corresponds to the maturity dates of the designated debt instruments. The floating rates are
based on three month LIBOR plus a margin. These interest rate swap agreements had a fair value gain of $74 million and a corresponding interest receivable
of $17 million, which were recorded in other noncurrent assets and accounts receivable, respectively, on our Consolidated Balance Sheet. In accordance with
fair value hedge accounting, the carrying value of our long-term debt at December 31, 2008 included $74 million of fair value adjustments.
In the Merger, we assumed Northwest's outstanding interest rate swap and cap agreements. On the Closing Date, we designated these derivative
instruments as cash flow hedges under SFAS 133 for purposes of converting our interest rate exposure on a portion of our debt portfolio from a floating rate to
a fixed rate. The interest rate swap and cap agreements have an aggregate notional amount of $1.7 billion and mature from December 2009 through May
2019, which corresponds to the maturity dates of the designated debt instruments. The floating rates are based on three month LIBOR plus a margin. These
interest rate swap and cap agreements had a fair value loss of $95 million, which is recorded in hedge derivatives liability and other noncurrent liabilities on
our Consolidated Balance Sheet.
Market risk associated with our cash portfolio relates to the potential change in interest income from a decrease in interest rates. Workers' compensation
obligation risk relates to the potential changes in our future obligations and expenses from a change in interest rates used to discount these obligations.
Pension, postemployment and postretirement benefits risk relates to the potential changes in our benefit obligations, funding and expenses from a change in
interest rates.
Foreign Currency Exchange Risk
We are subject to foreign currency exchange risk because we have revenue and expense denominated in foreign currencies, primarily the euro, the
British pound, the Japanese yen and the Canadian dollar. To manage exchange rate risk, we attempt to execute both our international revenue and expense
transactions in the same foreign currency to the extent practicable. From time to time, we may also enter into foreign currency options and forward contracts.
In the Merger, we assumed Northwest's outstanding foreign currency derivative instruments. On the Closing Date, we designated certain of these
derivative instruments, comprised of Japanese yen forward and collar
F-27