Delta Airlines 2008 Annual Report Download - page 131
Download and view the complete annual report
Please find page 131 of the 2008 Delta Airlines annual report below. You can navigate through the pages in the report by either clicking on the pages listed below, or by using the keyword search tool below to find specific information within the annual report.-
 1
1 -
2
-
3
-
4
-
5
-
6
-
7
-
8
-
9
-
10
-
11
-
12
-
13
-
14
-
15
-
16
-
17
-
18
-
19
-
20
-
21
-
22
-
23
-
24
-
25
-
26
-
27
-
28
-
29
-
30
-
31
-
32
-
33
-
34
-
35
-
36
-
37
-
38
-
39
-
40
-
41
-
42
-
43
-
44
-
45
-
46
-
47
-
48
-
49
-
50
-
51
-
52
-
53
-
54
-
55
-
56
-
57
-
58
-
59
-
60
-
61
-
62
-
63
-
64
-
65
-
66
-
67
-
68
-
69
-
70
-
71
-
72
-
73
-
74
-
75
-
76
-
77
-
78
-
79
-
80
-
81
-
82
-
83
-
84
-
85
-
86
-
87
-
88
-
89
-
90
-
91
-
92
-
93
-
94
-
95
-
96
-
97
-
98
-
99
-
100
-
101
-
102
-
103
-
104
-
105
-
106
-
107
-
108
-
109
-
110
-
111
-
112
-
113
-
114
-
115
-
116
-
117
-
118
-
119
-
120
-
 121
121 -
 122
122 -
 123
123 -
 124
124 -
 125
125 -
 126
126 -
 127
127 -
 128
128 -
 129
129 -
 130
130 -
 131
131 -
 132
132 -
 133
133 -
 134
134 -
 135
135 -
 136
136 -
 137
137 -
 138
138 -
 139
139 -
 140
140 -
 141
141 -
142
-
143
-
144
-
145
-
146
-
147
-
148
-
149
-
150
-
151
-
152
-
153
-
154
-
155
-
156
-
157
-
158
-
159
-
160
-
161
-
162
-
163
-
164
-
165
-
166
-
167
-
168
-
169
-
170
-
171
-
172
-
173
-
174
-
175
-
176
-
177
-
178
-
179
-
180
-
181
-
182
-
183
-
184
-
185
-
186
-
187
-
188
-
189
-
190
-
191
-
192
-
193
-
194
-
195
-
196
-
197
-
198
-
199
-
200
-
201
-
202
-
203
-
204
-
205
-
206
-
207
-
208
 |
 |

Table of Contents
Index to Financial Statements
NOTES TO THE CONSOLIDATED FINANCIAL STATEMENTS—(Continued)
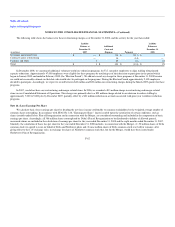
We are managed as a single business unit that provides air transportation for passengers and cargo. This allows us to benefit from an integrated revenue
pricing and route network. Our flight equipment forms one fleet, which is deployed through a single route scheduling system. When making resource
allocation decisions, our chief operating decision maker evaluates flight profitability data, which considers aircraft type and route economics, but gives no
weight to the financial impact of the resource allocation decision on an individual carrier basis. Our objective in making resource allocation decisions is to
optimize our consolidated financial results.
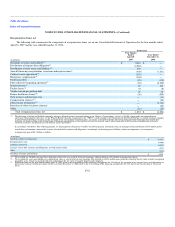
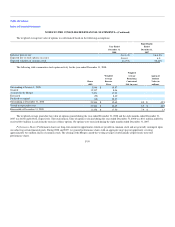
Operating revenue is assigned to a specific geographic region based on the origin, flight path and destination of each flight segment. Our operating
revenue by geographic region for the year ended December 31, 2008, the eight months ended December 31, 2007, the four months ended April 30, 2007 and
the year ended December 31, 2006 are summarized in the following table:
Successor Predecessor
(in millions)
Year Ended
December 31,
2008
Eight Months
Ended
December 31,
2007
Four Months
Ended
April 30,
2007
Year Ended
December 31,
2006
North America $ 15,065 $ 9,380 $ 4,314 $ 13,204
Atlantic 5,149 2,884 947 3,058
Latin America 1,616 923 478 1,102
Pacific 867 171 57 168
Total $ 22,697 $ 13,358 $ 5,796 $ 17,532
Our tangible assets consist primarily of flight equipment, which is mobile across geographic markets. Accordingly, assets are not allocated to specific
geographic regions.
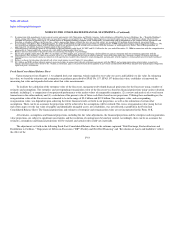
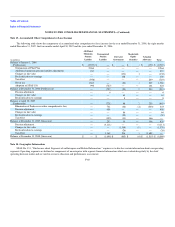
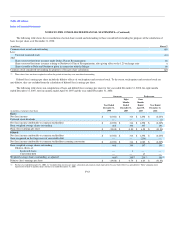
Note 15. Restructuring and Merger-Related Items
The following table shows charges recorded in restructuring and merger-related items on our Consolidated Statement of Operations for the year ended
December 31, 2008:
(in millions)
Year
Ended
December 31,
2008
Severance and related costs(1) $ 114
Contract Carrier restructuring(2) 14
Facilities and other(3) 25
Total restructuring 153
Merger-related items(4) 978
Total restructuring and merger-related items $ 1,131
(1) Relates to two voluntary workforce reduction programs for U.S. non-pilot employees announced in March 2008 in which approximately 4,200 employees elected to participate. These
programs were intended to align staffing with planned capacity reductions.
(2) Relates to the early termination of certain capacity purchase agreements with our Contract Carriers.
(3) Primarily relates to the closing of operations in Concourse C at the Cincinnati Airport. Upon our exit from Concourse C, we recorded a one-time charge of $18 million based on the
estimated present value of future rents.
(4) Includes a one-time primarily non-cash charge of $907 million relating to the issuance or vesting of employee equity awards in connection with the Merger.
F-61