Delta Airlines 2008 Annual Report Download - page 120
Download and view the complete annual report
Please find page 120 of the 2008 Delta Airlines annual report below. You can navigate through the pages in the report by either clicking on the pages listed below, or by using the keyword search tool below to find specific information within the annual report.-
 1
1 -
2
-
3
-
4
-
5
-
6
-
7
-
8
-
9
-
10
-
11
-
12
-
13
-
14
-
15
-
16
-
17
-
18
-
19
-
20
-
21
-
22
-
23
-
24
-
25
-
26
-
27
-
28
-
29
-
30
-
31
-
32
-
33
-
34
-
35
-
36
-
37
-
38
-
39
-
40
-
41
-
42
-
43
-
44
-
45
-
46
-
47
-
48
-
49
-
50
-
51
-
52
-
53
-
54
-
55
-
56
-
57
-
58
-
59
-
60
-
61
-
62
-
63
-
64
-
65
-
66
-
67
-
68
-
69
-
70
-
71
-
72
-
73
-
74
-
75
-
76
-
77
-
78
-
79
-
80
-
81
-
82
-
83
-
84
-
85
-
86
-
87
-
88
-
89
-
90
-
91
-
92
-
93
-
94
-
95
-
96
-
97
-
98
-
99
-
100
-
101
-
102
-
103
-
104
-
105
-
106
-
107
-
108
-
109
-
 110
110 -
 111
111 -
 112
112 -
 113
113 -
 114
114 -
 115
115 -
 116
116 -
 117
117 -
 118
118 -
 119
119 -
 120
120 -
 121
121 -
 122
122 -
 123
123 -
 124
124 -
 125
125 -
 126
126 -
 127
127 -
 128
128 -
 129
129 -
 130
130 -
131
-
132
-
133
-
134
-
135
-
136
-
137
-
138
-
139
-
140
-
141
-
142
-
143
-
144
-
145
-
146
-
147
-
148
-
149
-
150
-
151
-
152
-
153
-
154
-
155
-
156
-
157
-
158
-
159
-
160
-
161
-
162
-
163
-
164
-
165
-
166
-
167
-
168
-
169
-
170
-
171
-
172
-
173
-
174
-
175
-
176
-
177
-
178
-
179
-
180
-
181
-
182
-
183
-
184
-
185
-
186
-
187
-
188
-
189
-
190
-
191
-
192
-
193
-
194
-
195
-
196
-
197
-
198
-
199
-
200
-
201
-
202
-
203
-
204
-
205
-
206
-
207
-
208
 |
 |

Table of Contents
Index to Financial Statements
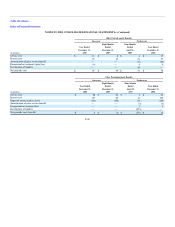
NOTES TO THE CONSOLIDATED FINANCIAL STATEMENTS—(Continued)
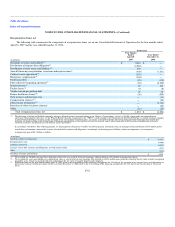
Pension Plan Assets
Delta and Northwest have adopted and implemented investment policies for their defined benefit pension plans that incorporate strategic asset
allocation mixes intended to best meet their long-term pension obligations. This asset allocation policy mix is reviewed every 2-5 years or earlier as deemed
necessary. On a regular basis, actual asset allocations are rebalanced toward the prevailing targets. The targeted and actual weighted-average asset allocations
for the pension plans at December 31, 2008 and December 31, 2007 are as follows:
Target
Allocations 2008 2007
U.S. equity securities 32-35% 33% 35%
Non-U.S. equity securities 19-25% 19% 15%
High quality bonds and long term duration 15-19% 18% 20%
Convertible and high yield bonds 5% 8% 8%
Private equity 10-14% 18% 15%
Real estate 10-11% 4% 7%
Total 100% 100%
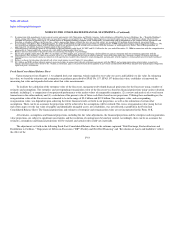
The investment strategies for pension plan assets are to utilize a diversified mix of global public and private equity portfolios, public and private fixed
income portfolios, and private real estate and natural resource investments. The overall asset mix of the portfolios is more heavily weighted in equity-like
investments, including portions of the bond portfolio, which consist of convertible and high yield securities. Active management strategies are utilized where
feasible in an effort to realize investment returns in excess of market indices. Also, currency overlay strategy is used in an effort to generate modest amounts
of additional income. A bond duration extension program utilizing fixed income derivatives is employed in an effort to better align the market value
movements of a portion of the pension plan assets to the related pension plan liabilities.
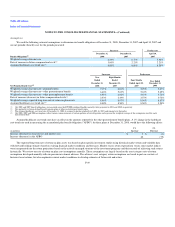
Benefit Payments
Benefit payments in the table below are based on the same assumptions used to measure the related benefit obligations and are paid from both funded
benefit plan trusts and current assets. Actual benefit payments may vary significantly from these estimates. Benefits earned under our pension plans and
certain postemployment benefit plans are expected to be paid from funded benefit plan trusts, while our other postretirement benefits are funded from current
assets.
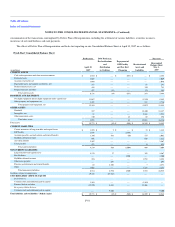
The following table summarizes, as of December 31, 2008, the benefit payments that are scheduled to be paid in the following years ending
December 31:
(in millions)
Pension
Benefits
Other
Postretirement
Benefits
Other
Postemployment
Benefits
2009 $ 1,002 $ 140 $ 150
2010 993 141 152
2011 998 139 156
2012 1,010 132 160
2013 1,027 125 165
2014-2018 6,049 602 899
Total $ 11,079 $ 1,279 $ 1,682
F-50