Delta Airlines 2008 Annual Report Download - page 133
Download and view the complete annual report
Please find page 133 of the 2008 Delta Airlines annual report below. You can navigate through the pages in the report by either clicking on the pages listed below, or by using the keyword search tool below to find specific information within the annual report.-
 1
1 -
2
-
3
-
4
-
5
-
6
-
7
-
8
-
9
-
10
-
11
-
12
-
13
-
14
-
15
-
16
-
17
-
18
-
19
-
20
-
21
-
22
-
23
-
24
-
25
-
26
-
27
-
28
-
29
-
30
-
31
-
32
-
33
-
34
-
35
-
36
-
37
-
38
-
39
-
40
-
41
-
42
-
43
-
44
-
45
-
46
-
47
-
48
-
49
-
50
-
51
-
52
-
53
-
54
-
55
-
56
-
57
-
58
-
59
-
60
-
61
-
62
-
63
-
64
-
65
-
66
-
67
-
68
-
69
-
70
-
71
-
72
-
73
-
74
-
75
-
76
-
77
-
78
-
79
-
80
-
81
-
82
-
83
-
84
-
85
-
86
-
87
-
88
-
89
-
90
-
91
-
92
-
93
-
94
-
95
-
96
-
97
-
98
-
99
-
100
-
101
-
102
-
103
-
104
-
105
-
106
-
107
-
108
-
109
-
110
-
111
-
112
-
113
-
114
-
115
-
116
-
117
-
118
-
119
-
120
-
121
-
122
-
 123
123 -
 124
124 -
 125
125 -
 126
126 -
 127
127 -
 128
128 -
 129
129 -
 130
130 -
 131
131 -
 132
132 -
 133
133 -
 134
134 -
 135
135 -
 136
136 -
 137
137 -
 138
138 -
 139
139 -
 140
140 -
 141
141 -
 142
142 -
 143
143 -
144
-
145
-
146
-
147
-
148
-
149
-
150
-
151
-
152
-
153
-
154
-
155
-
156
-
157
-
158
-
159
-
160
-
161
-
162
-
163
-
164
-
165
-
166
-
167
-
168
-
169
-
170
-
171
-
172
-
173
-
174
-
175
-
176
-
177
-
178
-
179
-
180
-
181
-
182
-
183
-
184
-
185
-
186
-
187
-
188
-
189
-
190
-
191
-
192
-
193
-
194
-
195
-
196
-
197
-
198
-
199
-
200
-
201
-
202
-
203
-
204
-
205
-
206
-
207
-
208
 |
 |

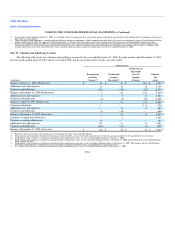
Table of Contents
Index to Financial Statements
NOTES TO THE CONSOLIDATED FINANCIAL STATEMENTS—(Continued)
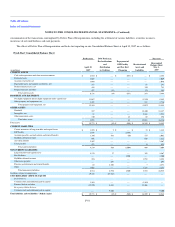
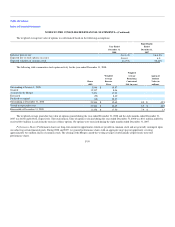
The following table shows the reconciliation of actual shares issued and outstanding to those considered outstanding for purposes of the calculation of
basic loss per share as of December 31, 2008:
(in millions) Shares(1)
Common stock issued and outstanding 695
Less:
Unvested restricted stock (18)
Add:
Shares reserved for future issuance under Delta's Plan of Reorganization 89
Shares reserved for future issuance relating to Northwest's Plan of Reorganization, after giving effect to the 1.25 exchange ratio 9
Shares issuable to Delta and Northwest pilots in connection with the Merger 50
Common stock considered outstanding for purposes of loss per share calculation 825
(1) These shares have not been weighted to reflect the period of time they were considered outstanding.
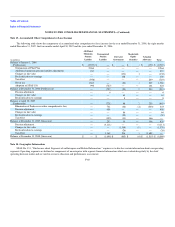
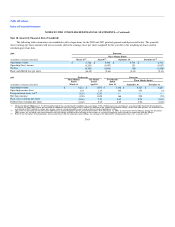
Diluted (loss) earnings per share include the dilutive effects of stock options and restricted stock. To the extent stock options and restricted stock are
anti-dilutive, they are excluded from the calculation of diluted (loss) earnings per share.
The following table shows our computation of basic and diluted (loss) earnings per share for the year ended December 31, 2008, the eight months
ended December 31, 2007, the four months ended April 30, 2007 and the year ended December 31, 2006:
Successor Predecessor
(in millions, except per share data)
Year Ended
December 31,
2008
Eight
Months
Ended
December 31,
2007
Four
Months
Ended
April 30,
2007
Year Ended
December 31,
2006
Basic:
Net (loss) income $ (8,922) $ 314 $ 1,298 $ (6,203)
Preferred stock dividends — — — (2)
Net (loss) income attributable to common stockholders $ (8,922) $ 314 $ 1,298 $ (6,205)
Basic weighted average shares outstanding 468 394 197 196
Basic (loss) earnings per share $ (19.08) $ 0.80 $ 6.58 $ (31.58)
Diluted:
Net (loss) income attributable to common stockholders $ (8,922) $ 314 $ 1,298 $ (6,205)
Gain recognized on the forgiveness of convertible debt — — (216) —
Net (loss) income attributable to common stockholders assuming conversion $ (8,922) $ 314 $ 1,082 $ (6,205)
Basic weighted average shares outstanding 468 394 197 196
Dilutive effects of:
Restricted shares — 1 — —
Convertible debt — — 37 —
Weighted average shares outstanding, as adjusted 468(1) 395(2) 234(3) 196(4)
Dilutive (loss) earnings per share $ (19.08) $ 0.79 $ 4.63 $ (31.58)
(1) For the year ended December 31, 2008, we excluded from our loss per share calculation all common stock equivalents because their effect was anti-dilutive. These common stock
equivalents totaled 41 million shares for the year ended December 31, 2008.
F-63