Delta Airlines 2008 Annual Report Download - page 45
Download and view the complete annual report
Please find page 45 of the 2008 Delta Airlines annual report below. You can navigate through the pages in the report by either clicking on the pages listed below, or by using the keyword search tool below to find specific information within the annual report.-
 1
1 -
2
-
3
-
4
-
5
-
6
-
7
-
8
-
9
-
10
-
11
-
12
-
13
-
14
-
15
-
16
-
17
-
18
-
19
-
20
-
21
-
22
-
23
-
24
-
25
-
26
-
27
-
28
-
29
-
30
-
31
-
32
-
33
-
34
-
 35
35 -
 36
36 -
 37
37 -
 38
38 -
 39
39 -
 40
40 -
 41
41 -
 42
42 -
 43
43 -
 44
44 -
 45
45 -
 46
46 -
 47
47 -
 48
48 -
 49
49 -
 50
50 -
 51
51 -
 52
52 -
 53
53 -
 54
54 -
 55
55 -
56
-
57
-
58
-
59
-
60
-
61
-
62
-
63
-
64
-
65
-
66
-
67
-
68
-
69
-
70
-
71
-
72
-
73
-
74
-
75
-
76
-
77
-
78
-
79
-
80
-
81
-
82
-
83
-
84
-
85
-
86
-
87
-
88
-
89
-
90
-
91
-
92
-
93
-
94
-
95
-
96
-
97
-
98
-
99
-
100
-
101
-
102
-
103
-
104
-
105
-
106
-
107
-
108
-
109
-
110
-
111
-
112
-
113
-
114
-
115
-
116
-
117
-
118
-
119
-
120
-
121
-
122
-
123
-
124
-
125
-
126
-
127
-
128
-
129
-
130
-
131
-
132
-
133
-
134
-
135
-
136
-
137
-
138
-
139
-
140
-
141
-
142
-
143
-
144
-
145
-
146
-
147
-
148
-
149
-
150
-
151
-
152
-
153
-
154
-
155
-
156
-
157
-
158
-
159
-
160
-
161
-
162
-
163
-
164
-
165
-
166
-
167
-
168
-
169
-
170
-
171
-
172
-
173
-
174
-
175
-
176
-
177
-
178
-
179
-
180
-
181
-
182
-
183
-
184
-
185
-
186
-
187
-
188
-
189
-
190
-
191
-
192
-
193
-
194
-
195
-
196
-
197
-
198
-
199
-
200
-
201
-
202
-
203
-
204
-
205
-
206
-
207
-
208
 |
 |

Table of Contents
Index to Financial Statements
International Passenger Revenue. International passenger revenue increased 28%, generated by a 17% increase in RPMs on a 16% increase in capacity
and an 11% increase in PRASM. The passenger mile yield increased 9%. These results reflect increases in service to international destinations, primarily in
the Atlantic and Latin America markets, from the restructuring of our route network. Our mix of domestic versus international capacity was 67% and 33%,
respectively, for 2007, compared to 71% and 29%, respectively, for 2006.
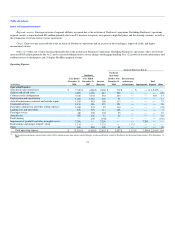
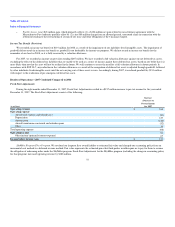
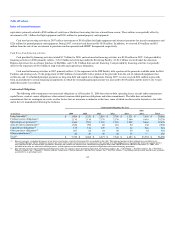
Operating Expense
Combined Predecessor
Increase
(Decrease)
%
Increase
(Decrease)
(in millions)
Year Ended
December 31,
2007
Year Ended
December 31,
2006
Operating Expense:
Aircraft fuel and related taxes $ 4,686 $ 4,433 $ 253 6 %
Salaries and related costs 4,189 4,365 (176) (4)%
Contract carrier arrangements 3,152 2,656 496 19 %
Depreciation and amortization 1,164 1,276 (112) (9)%
Contracted services 996 918 78 8 %
Aircraft maintenance materials and outside repairs 983 921 62 7 %
Passenger commissions and other selling expenses 933 888 45 5 %
Landing fees and other rents 725 881 (156) (18)%
Passenger service 338 332 6 2 %
Aircraft rent 246 316 (70) (22)%
Profit sharing 158 — 158 NM
Restructuring, asset writedowns, pension settlements and related items, net — 13 (13) (100)%
Other 488 475 13 3 %
Total operating expense $ 18,058 $ 17,474 $ 584 3 %
Operating expense was $18.1 billion for 2007, a $584 million, or 3%, increase compared to 2006. Operating capacity increased 3% to 151.8 billion
ASMs due mainly to increases in service to international destinations, primarily in the Atlantic and Latin America markets, from the restructuring of our route
network and higher contract carrier flying from our initiatives to right-size capacity. Cost per available seat mile ("CASM") increased 1% to 11.90¢.
Aircraft fuel and related taxes. Aircraft fuel and related taxes increased primarily due to higher average fuel prices and increased Mainline
consumption. These increases were partially offset by gains on our fuel hedging derivatives. Fuel prices averaged $2.21 per gallon, including fuel hedge gains
of $51 million, for 2007, compared to $2.10 per gallon, including fuel hedge losses of $108 million, for 2006.
Salaries and related costs. The decrease in salaries and related costs reflects a decline of (1) $382 million due to benefit cost reductions for our pilot
and non-pilot employees and (2) $90 million due to a charge during 2006 associated with Accounting Adjustments discussed above. These decreases were
partially offset by (1) expense associated with share-based compensation resulting from equity awards granted upon emergence from bankruptcy and (2) an
8% increase in Mainline headcount due to our expansion at New York-JFK and our assumption of Atlantic Southeast Airlines, Inc. ("ASA") ramp operations
in Atlanta.
Contract carrier arrangements. Contract carrier arrangements expense increased due to a 16% growth in contract carrier flying from our business plan
initiatives to right-size capacity in domestic markets and due to higher average fuel prices. Fuel prices for our contract carriers averaged $2.37 per gallon for
2007, compared to $2.22 per gallon for 2006.
40