Delta Airlines 2008 Annual Report Download - page 49
Download and view the complete annual report
Please find page 49 of the 2008 Delta Airlines annual report below. You can navigate through the pages in the report by either clicking on the pages listed below, or by using the keyword search tool below to find specific information within the annual report.-
 1
1 -
2
-
3
-
4
-
5
-
6
-
7
-
8
-
9
-
10
-
11
-
12
-
13
-
14
-
15
-
16
-
17
-
18
-
19
-
20
-
21
-
22
-
23
-
24
-
25
-
26
-
27
-
28
-
29
-
30
-
31
-
32
-
33
-
34
-
35
-
36
-
37
-
38
-
 39
39 -
 40
40 -
 41
41 -
 42
42 -
 43
43 -
 44
44 -
 45
45 -
 46
46 -
 47
47 -
 48
48 -
 49
49 -
 50
50 -
 51
51 -
 52
52 -
 53
53 -
 54
54 -
 55
55 -
 56
56 -
 57
57 -
 58
58 -
 59
59 -
60
-
61
-
62
-
63
-
64
-
65
-
66
-
67
-
68
-
69
-
70
-
71
-
72
-
73
-
74
-
75
-
76
-
77
-
78
-
79
-
80
-
81
-
82
-
83
-
84
-
85
-
86
-
87
-
88
-
89
-
90
-
91
-
92
-
93
-
94
-
95
-
96
-
97
-
98
-
99
-
100
-
101
-
102
-
103
-
104
-
105
-
106
-
107
-
108
-
109
-
110
-
111
-
112
-
113
-
114
-
115
-
116
-
117
-
118
-
119
-
120
-
121
-
122
-
123
-
124
-
125
-
126
-
127
-
128
-
129
-
130
-
131
-
132
-
133
-
134
-
135
-
136
-
137
-
138
-
139
-
140
-
141
-
142
-
143
-
144
-
145
-
146
-
147
-
148
-
149
-
150
-
151
-
152
-
153
-
154
-
155
-
156
-
157
-
158
-
159
-
160
-
161
-
162
-
163
-
164
-
165
-
166
-
167
-
168
-
169
-
170
-
171
-
172
-
173
-
174
-
175
-
176
-
177
-
178
-
179
-
180
-
181
-
182
-
183
-
184
-
185
-
186
-
187
-
188
-
189
-
190
-
191
-
192
-
193
-
194
-
195
-
196
-
197
-
198
-
199
-
200
-
201
-
202
-
203
-
204
-
205
-
206
-
207
-
208
 |
 |

Table of Contents
Index to Financial Statements
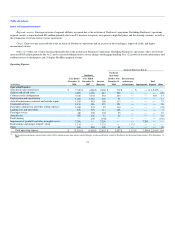
equivalents, primarily related to $500 million of cash from a Northwest borrowing that was released from escrow. These inflows were partially offset by
investments of $1.3 billion for flight equipment and $241 million for ground property and equipment.
Cash used in investing activities in 2007 reflects investments of $810 million for flight equipment and advanced payments for aircraft commitments and
$226 million for ground property and equipment. During 2007, restricted cash decreased by $185 million. In addition, we received $34 million and $83
million from the sale of our investments in priceline.com Incorporated and ARINC Incorporated, respectively.
Cash flows from financing activities
Cash provided by financing activities totaled $1.7 billion for 2008, and cash used in financing activities was $120 million in 2007. Cash provided by
financing activities in 2008 primarily reflects (1) $1.0 billion in borrowings under the Revolving Facility, (2) $1.0 billion received under the American
Express Agreement for an advance purchase of SkyMiles, and (3) $1.0 billion from aircraft financing. Cash provided by financing activities was partially
offset by the repayment of $1.6 billion of long-term debt and capital lease obligations.
Cash used in financing activities in 2007 primarily reflects (1) the repayment of the DIP Facility with a portion of the proceeds available under the Exit
Facilities and existing cash, (2) the prepayment of $863 million of secured debt with a portion of the proceeds from the sale of enhanced equipment trust
certificates and (3) scheduled principal payments on long-term debt and capital lease obligations. During 2007, we also received $181 million in proceeds
from an amendment to certain financing arrangements in which the outstanding principal amount was increased to $415 million and the interest rate we pay
under this facility was reduced.
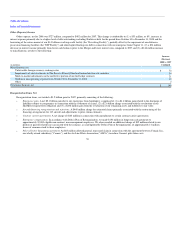
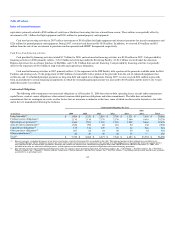
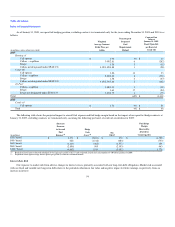
Contractual Obligations
The following table summarizes our contractual obligations as of December 31, 2008 that relate to debt, operating leases, aircraft order commitments,
capital leases, contract carrier obligations, other material, noncancelable purchase obligations and other commitments. The table does not include
commitments that are contingent on events or other factors that are uncertain or unknown at this time, some of which are discussed in footnotes to this table
and in the text immediately following the footnotes.
Contractual Obligations by Year
(in millions) 2009 2010 2011 2012 2013
After
2013 Total
Long-term debt(1) $ 1,984 $ 3,333 $ 2,884 $ 3,700 $ 1,321 $ 7,644 $ 20,866
Contract carrier obligations(2) 2,130 2,130 2,170 2,130 2,060 9,610 20,230
Operating lease payments(3) 1,646 1,559 1,326 1,204 1,059 5,664 12,458
Aircraft order commitments(4) 1,520 990 60 110 90 130 2,900
Capital lease obligations(5) 135 134 129 98 64 264 824
Other purchase obligations(6) 267 82 64 58 39 82 592
Other commitments(7) 40 40 40 40 20 — 180
Total(8) $ 7,722 $ 8,268 $ 6,673 $ 7,340 $ 4,653 $ 23,394 $ 58,050
(1) Interest payments, excluding the impact of our interest rate hedges, related to long-term debt are included in the table. The principal portion of these obligations is included in our
Consolidated Balance Sheets. Estimated amounts for future interest and related payments in connection with our long-term debt obligations are based on the fixed and variable interest
rates specified in the associated debt agreements. Estimates on variable rate interest were calculated using implied short-term LIBOR based on LIBOR at December 31, 2008. Also
included in the table are other debt-related payments, which represent credit enhancements required in conjunction with certain financing agreements.
(2) This amount represents our minimum fixed obligations under our contract carrier agreements with ASA, Chautauqua Airlines, Inc. ("Chautauqua"), Freedom Airlines, Inc. ("Freedom"),
Pinnacle Airlines, Inc. ("Pinnacle"), Shuttle America Corporation ("Shuttle America") and SkyWest Airlines, Inc. ("SkyWest Airlines") (excluding contract carrier aircraft lease payments
accounted for as operating leases).
44