Delta Airlines 2008 Annual Report Download - page 203
Download and view the complete annual report
Please find page 203 of the 2008 Delta Airlines annual report below. You can navigate through the pages in the report by either clicking on the pages listed below, or by using the keyword search tool below to find specific information within the annual report.-
 1
1 -
2
-
3
-
4
-
5
-
6
-
7
-
8
-
9
-
10
-
11
-
12
-
13
-
14
-
15
-
16
-
17
-
18
-
19
-
20
-
21
-
22
-
23
-
24
-
25
-
26
-
27
-
28
-
29
-
30
-
31
-
32
-
33
-
34
-
35
-
36
-
37
-
38
-
39
-
40
-
41
-
42
-
43
-
44
-
45
-
46
-
47
-
48
-
49
-
50
-
51
-
52
-
53
-
54
-
55
-
56
-
57
-
58
-
59
-
60
-
61
-
62
-
63
-
64
-
65
-
66
-
67
-
68
-
69
-
70
-
71
-
72
-
73
-
74
-
75
-
76
-
77
-
78
-
79
-
80
-
81
-
82
-
83
-
84
-
85
-
86
-
87
-
88
-
89
-
90
-
91
-
92
-
93
-
94
-
95
-
96
-
97
-
98
-
99
-
100
-
101
-
102
-
103
-
104
-
105
-
106
-
107
-
108
-
109
-
110
-
111
-
112
-
113
-
114
-
115
-
116
-
117
-
118
-
119
-
120
-
121
-
122
-
123
-
124
-
125
-
126
-
127
-
128
-
129
-
130
-
131
-
132
-
133
-
134
-
135
-
136
-
137
-
138
-
139
-
140
-
141
-
142
-
143
-
144
-
145
-
146
-
147
-
148
-
149
-
150
-
151
-
152
-
153
-
154
-
155
-
156
-
157
-
158
-
159
-
160
-
161
-
162
-
163
-
164
-
165
-
166
-
167
-
168
-
169
-
170
-
171
-
172
-
173
-
174
-
175
-
176
-
177
-
178
-
179
-
180
-
181
-
182
-
183
-
184
-
185
-
186
-
187
-
188
-
189
-
190
-
191
-
192
-
 193
193 -
 194
194 -
 195
195 -
 196
196 -
 197
197 -
 198
198 -
 199
199 -
 200
200 -
 201
201 -
 202
202 -
 203
203 -
 204
204 -
 205
205 -
 206
206 -
 207
207 -
 208
208
 |
 |
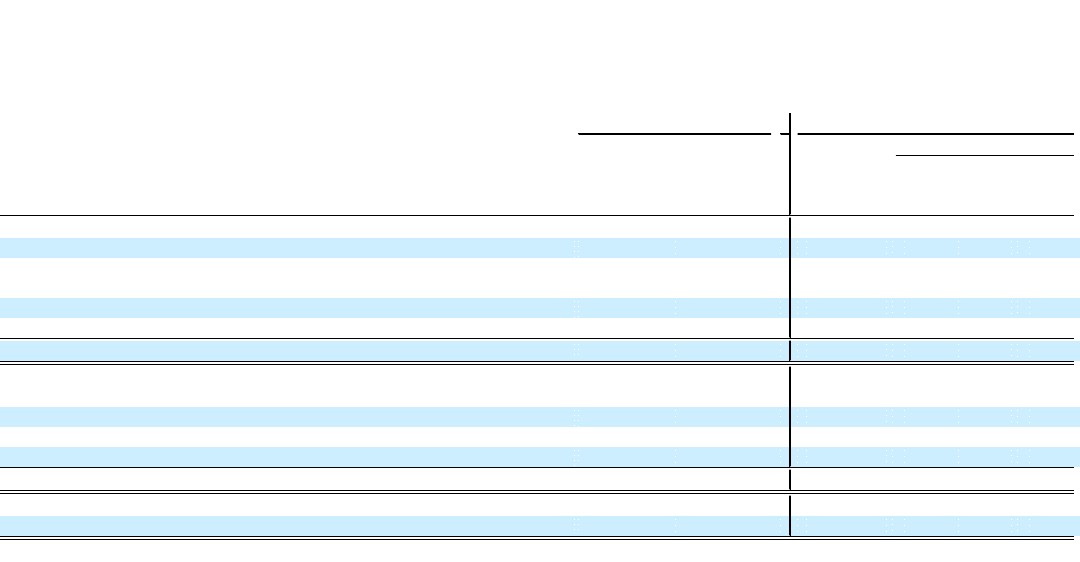
Exhibit 12.1
Delta Air Lines, Inc.
Computation of Ratio of Earnings to Fixed Charge
Successor Predecessor
Year
Ended
December 31,
2008
Eight Months
Ended
December 31,
2007
Four Months
Ended
April 30,
2007
Year Ended December 31,
(in millions, except for ratio data) 2006 2005 2004
(Loss) earnings:
(Loss) earnings before income taxes $ (9,041) $ 525 $ 1,294 $(6,968) $(3,859) $(3,992)
Add (deduct):
Fixed charges from below 810 432 285 970 1,274 1,126
Capitalized interest (23) (8) (3) (8) (9) (10)
(Loss) earnings as adjusted $ (8,254) $ 949 $ 1,576 $(6,006) $(2,594) $(2,876)
Fixed Charges:
Interest expense, including capitalized amounts and amortization of debt costs 728 398 265 878 1,041 834
Preference security dividend — — — 2 18 19
Portion of rental expense representative of the interest factor 82 34 20 90 215 273
$ 810 $ 432 $ 285 $ 970 $ 1,274 $ 1,126
Ratio of Earnings to Fixed Charges (10.19) 2.20 5.53 (6.19) (2.04) (2.55)